CIRCUTOR PowerStudio Series User Manual
Page 65
PowerStudio
User Manual 65
display it. Likewise, if a table is displayed and the graph button is clicked, PowerStudio client will
deduce that a graph of the variables shown on the table is desired.
The operation of the toolbar is absolutely the same as the operation of the same bar on the
graph view.
It is possible to configure some aspects using the table "Properties" option. This option can be
accessed using the “Options” menu, "Properties" submenu, or directly with the "Properties" button on
the main toolbar.
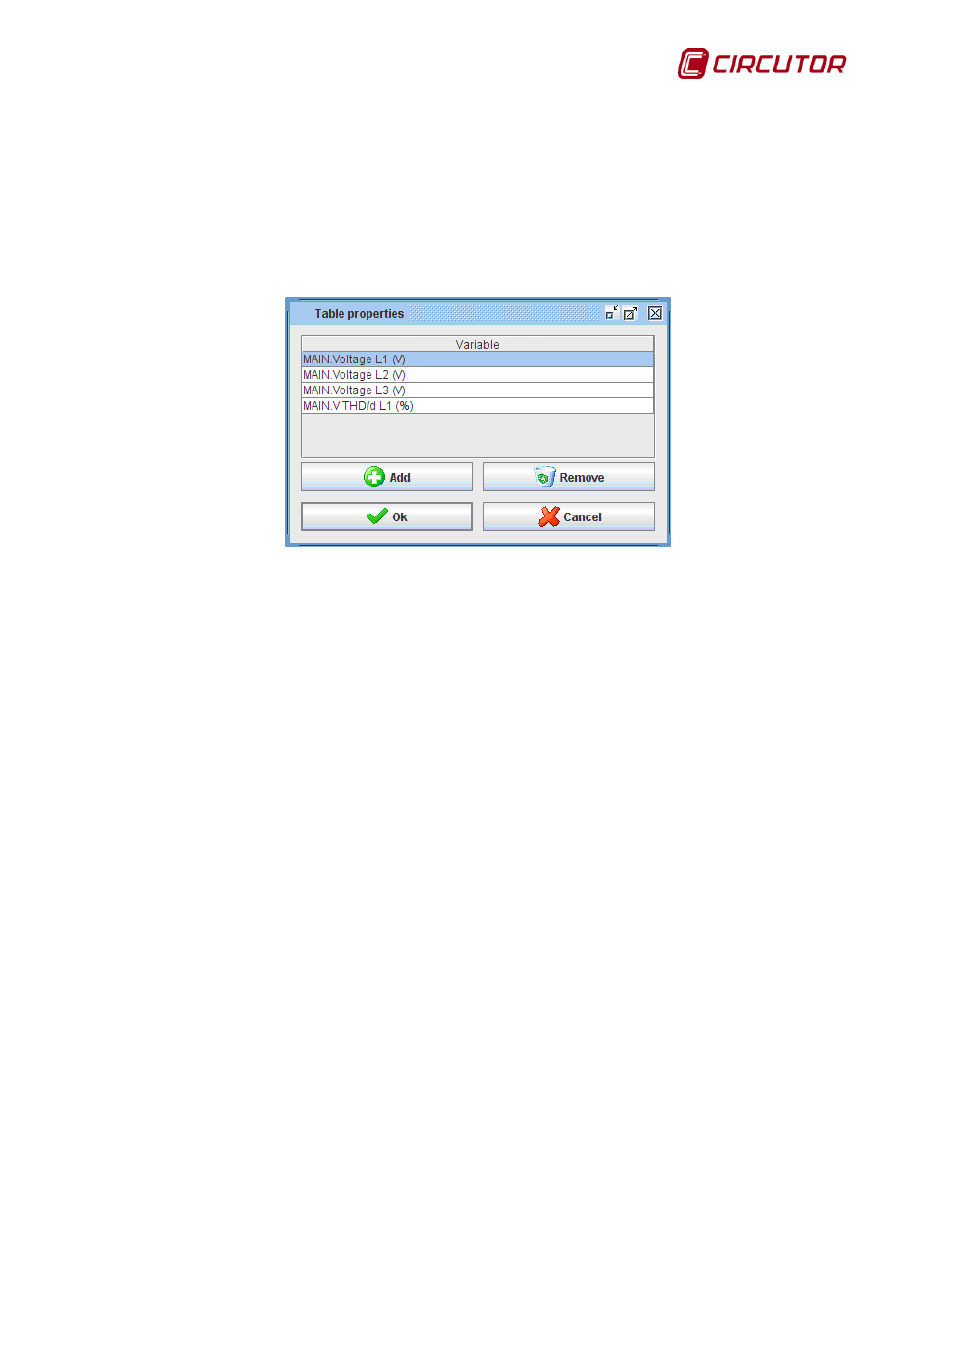
Table properties window
Use this window to add new variables to the table in the same way as they are added to the
graph, by clicking on "Add". It is also possible to delete variables from the table, simply by selecting the
desired variables and clicking on the “Delete” button.
As with the graphs, the user can print the current graph page at any time using the “Print”
option in the “Options” menu of the main menu or the "Print" button of the upper toolbar. Note that this
option, unlike that in the SCADA screens, is enabled for tables.
It is also possible to export this table by clicking "Export" in the "Options" menu of the main
menu. It will be exported in text format, where each line of text is a row of the table and where each
column is separated by the symbol ";".
A common feature in all tables is that they can be sorted by columns by clicking on them. By
default, tables usually appear sorted by date, usually the first column, but they can be ordered by other
variables. Clicking on the title of a column will place it in ascending order, clicking again on the same
place set it in descending order, and a third click will bring it back to its original format.
It is also possible to order a column so that a second column can later be ordered based upon
the first. For example, for a column representing a category type pertaining to each row, and another
representing a numerical value associated with each row, the category column may be ordered first by
clicking on its title, and afterwards, while holding the "CTRL" key, click the magnitude column (once for
ascending order or twice for descending order). This will order the table by group, and within each
group, by size.
QNA equipment allows a special table to be made called "Events" that lets you view a list of
events recorded by the equipment. This table can only be viewed from the corresponding button on the
equipment monitoring screen and does not correspond with any graph view.