3 tooltip mode, Tooltip mode – CIRCUTOR PowerStudio Series User Manual
Page 44
PowerStudio
44 User Manual
1.2.9.3 Tooltip mode
The "Tooltip mode" displays the values of variables located closest to the cursor with respect to
the X-axis. These values are updated instantly as the cursor is moved. In this mode the cursor looks
like a hand.
Cursor indicating Tooltip mode
The mode behaves in such a way as to show the values closest to the mouse position with
respect to the X-axis of all the areas that share the same X-axis.
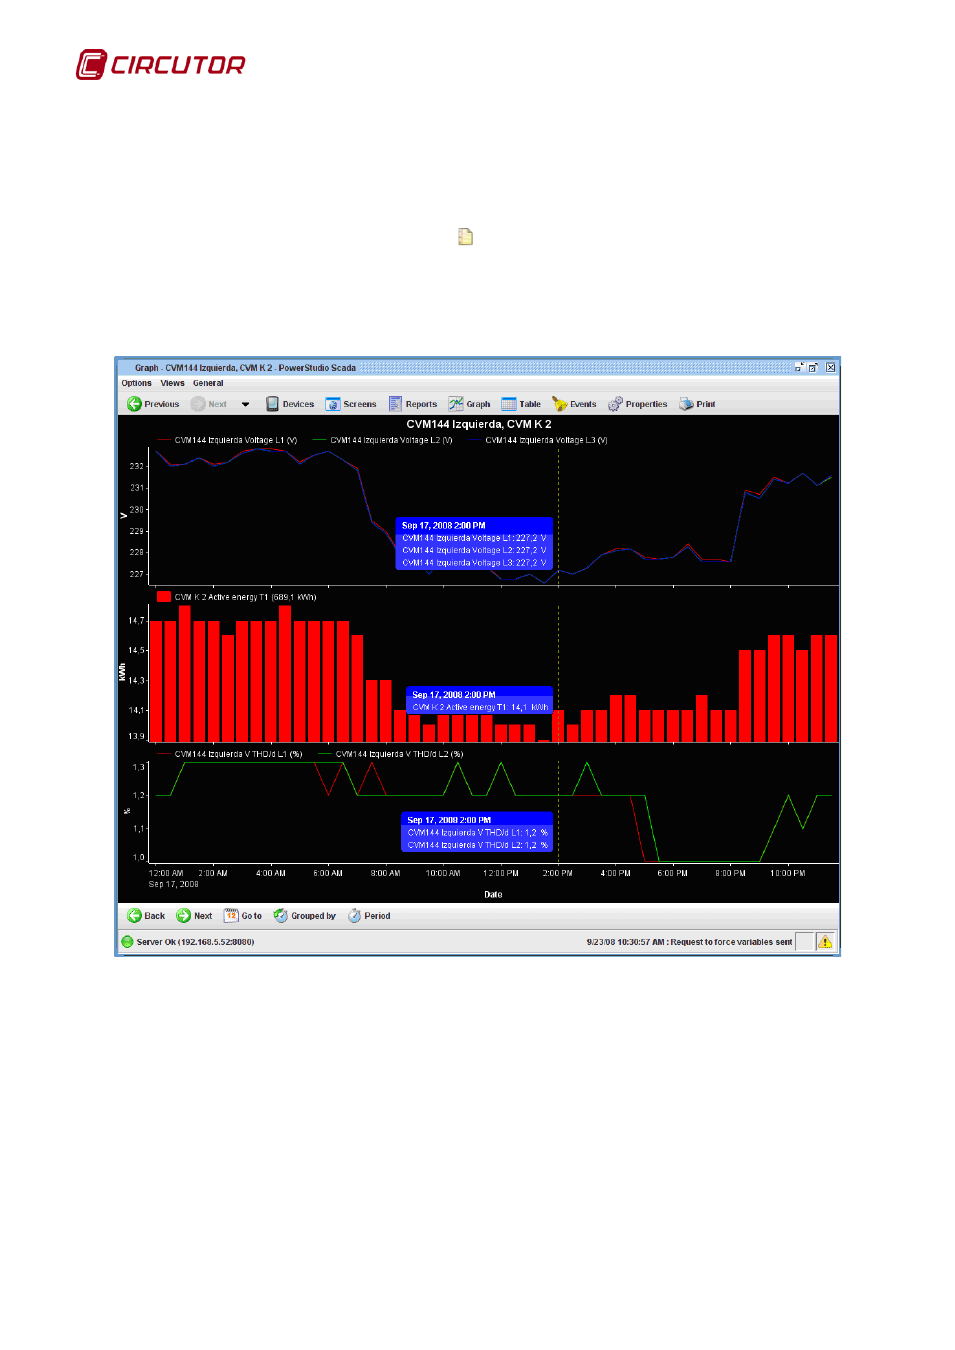
Graph in Tooltip mode
For each area of representation with the same X-axis a window is shown with the value of the
X-axis (typically the date) and information about the variables that are represented in this X position
(typically the variable name, its value and its units).
The behaviour of this mode is changed by clicking the "Control" key, so as to show only the
information window of the area at the cursor location.
In graphs with a high density of values several different values with different X coordinates of a
variable may fall into the same cursor position. In this case there will be no values accessible through
cursor movement. To access all the values, without omitting any, the value display window may be
moved using the cursor keys (left or right), these keys allow movement to the value immediately before
or immediately after the current, although this is drawn in the same screen position.