CIRCUTOR PowerStudio Series User Manual
Page 62
PowerStudio
62 User Manual
This type of graph represents the voltage events registered during a period of time, organized
according to their duration. This graph has some special features:
• X-axis: The X-axis represents the duration in milliseconds.
• Representation Interval: The events of a user defined time interval are represented.
• Toolbar: The toolbar may be used to move through time intervals, as well as define a new
time interval, either pre-defined or fully configurable by the user.
• Representation: The default representation is dots, although it can be changed at will.
• Tooltip: It is typical to see in such a figure a special tooltip indicating the number of values of
the variable that exist at this point, and between which values it can be found, as it is normal
that many values are repeated with certain duration.
• Subtitle: Unlike the harmonics and waveform graph, the subtitle here indicates the time
interval displayed.
• Adding new variables: Only variables of the type being viewed can be added, (i.e., duration
of events).
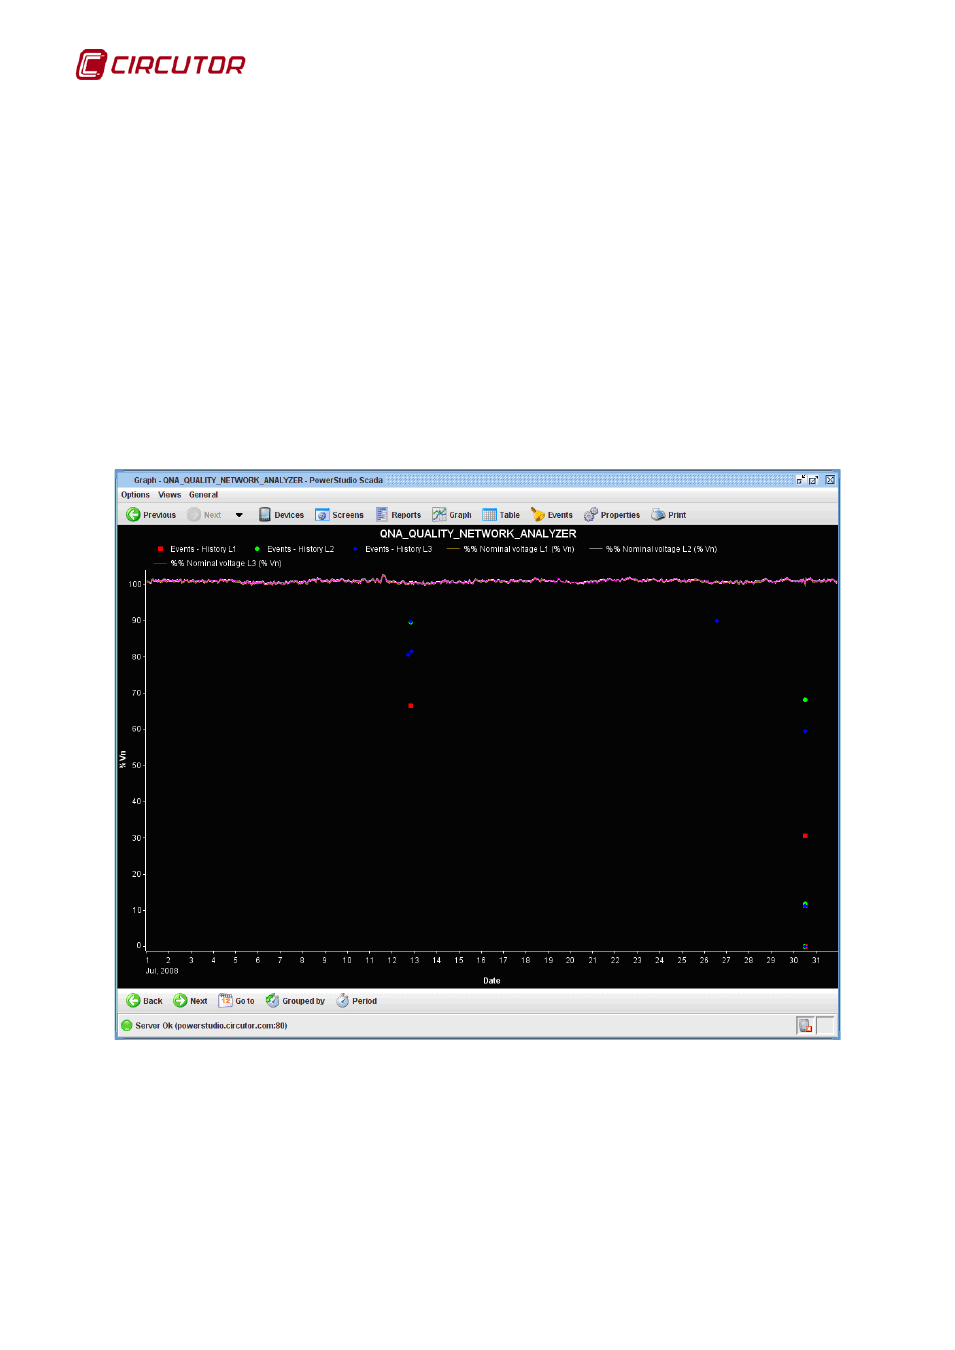
Another unusual graph is that of logged events.
Logged events graph
This figure is essentially equivalent to a standard graph, with all the same characteristics. The
only difference is that each event is depicted as a dot plus a horizontal line whose length equals the
duration of the event represented.
Usually the values of events this graph shows are accompanied by nominal voltage. In both
cases the units are expressed as a percentage of the nominal value. Any other standard variable may
also be added.