CIRCUTOR PowerStudio Series User Manual
Page 38
PowerStudio
38 User Manual
As can be seen a typical graph consists of a series of common characteristics:
• Title: Situated on the upper area, this is a text describing the graph being viewed. Typically,
the names of devices forming part of the displayed variables are shown. They may contain
several lines of text, so that they can be represented as subtitles.
• Representation areas: These are areas where data may be viewed. Typically, a graph
consists of one area, as in the previous example, but there may be several, each under the
next. Each area contains some common characteristics:
o
Key: Provides general information about the variables that are represented in the
area. This information is often the color of the variable, the type of representation, the
title of the graph, and in some cases, a value indicating some feature of the variable
for the current representation (for example it is typical to see on energy variables the
accumulated value of all the visible values).
o
Y-Axis: Provides information on the units of the variables that are represented in this
axis and the range of values that are being displayed. At first the range is calculated
so that they fit all the values of all the variables included in this axis. Typically, an area
has a y-axis, although this may be modified by the user as will be explained later.
o
X-axis: Typically, this is the time axis and is located at the bottom of the
representation area. Here the time interval being represented may be seen. Usually
predefined time intervals are represented (day, month, etc.). But the user can choose
the most suitable as can be seen later. Similarly, there are types of graphs where this
axis does not represent time, in this case the units represented and the range of
values contained will be indicated.
o
Drawing area: Contains the actual figure representing the variables of the area in
question. There is a drawing area for each area of representation.
• Toolbar: Contains a series of actions that can be performed on the graph. Depending on the
type of graph it will contain more or fewer options. The typical actions are going to the previous
interval, going to the next, going to a user-defined interval, grouping according to a predefined
interval or changing the grouping period.
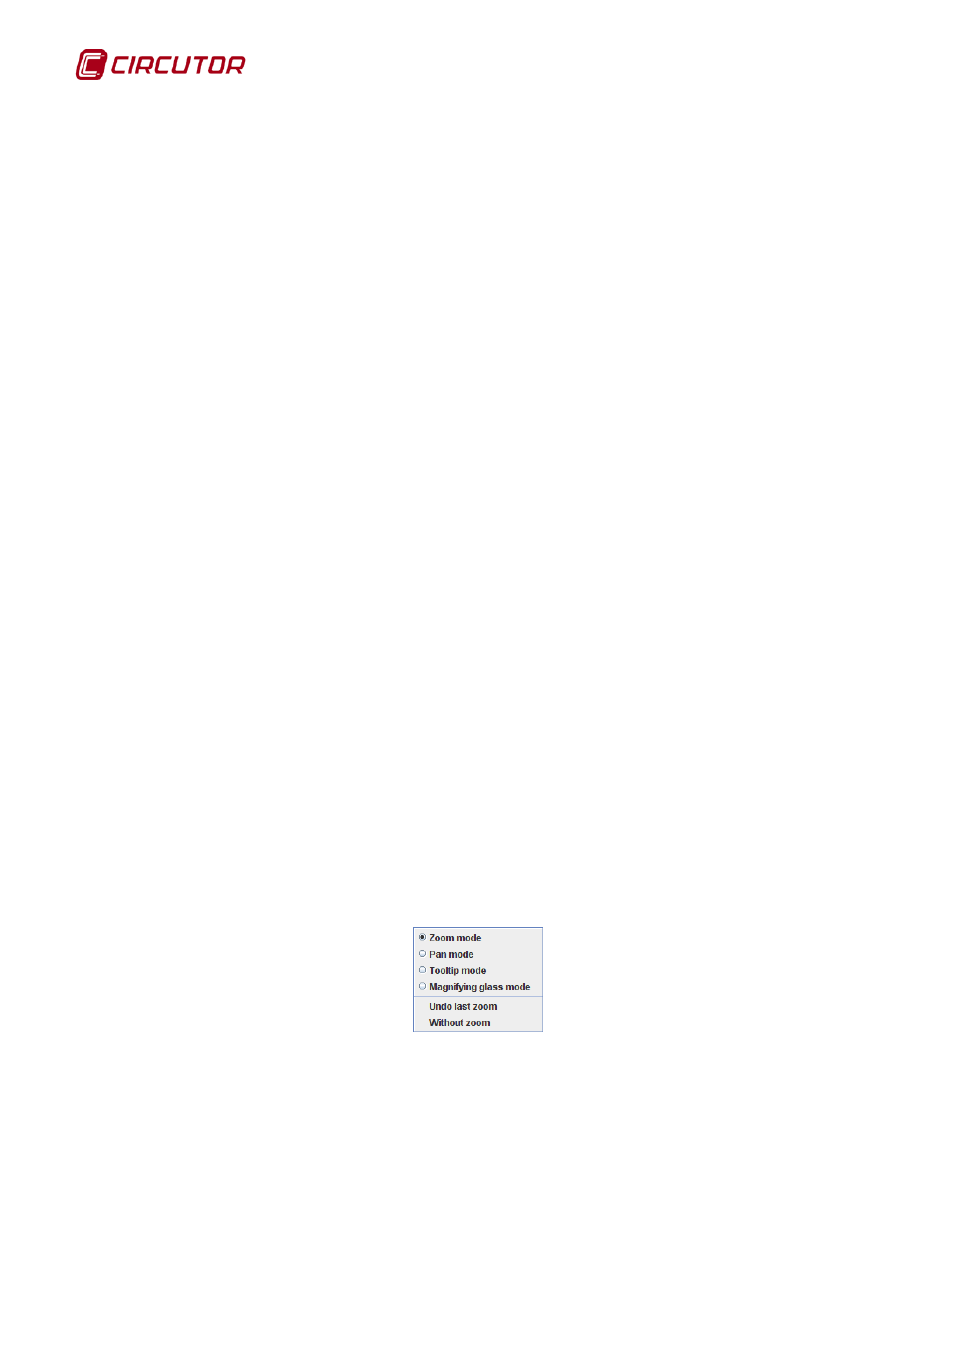
Any graph can always be found in the so-called "operating mode", which determines the
behaviour of the drawing area and the use of the mouse on it. There are four possible modes of
operation:
• Zoom mode: Allows enlargements be made on one portion of the graph. This mode is
accessed through the F1 key or the corresponding graph context menu option.
• Panning Mode: Allows the current window to be moved using the mouse, dragging and
dropping. This mode is only available if a Zoom has already been carried out. It is accessed by
the F1 key or the corresponding graph context menu option.
• Tooltip Mode: Allows variable values viewing at the position cursor. This mode is accessed
with the F3 key or the related context menu option.
• Magnifying glass Mode: Enables the area under the cursor to be enlarged in a separate
window. This mode is accessed with the F4 key or the related context menu option.
Graph context menu