CIRCUTOR PowerStudio Series User Manual
Page 89
Advertising
PowerStudio
User Manual 89
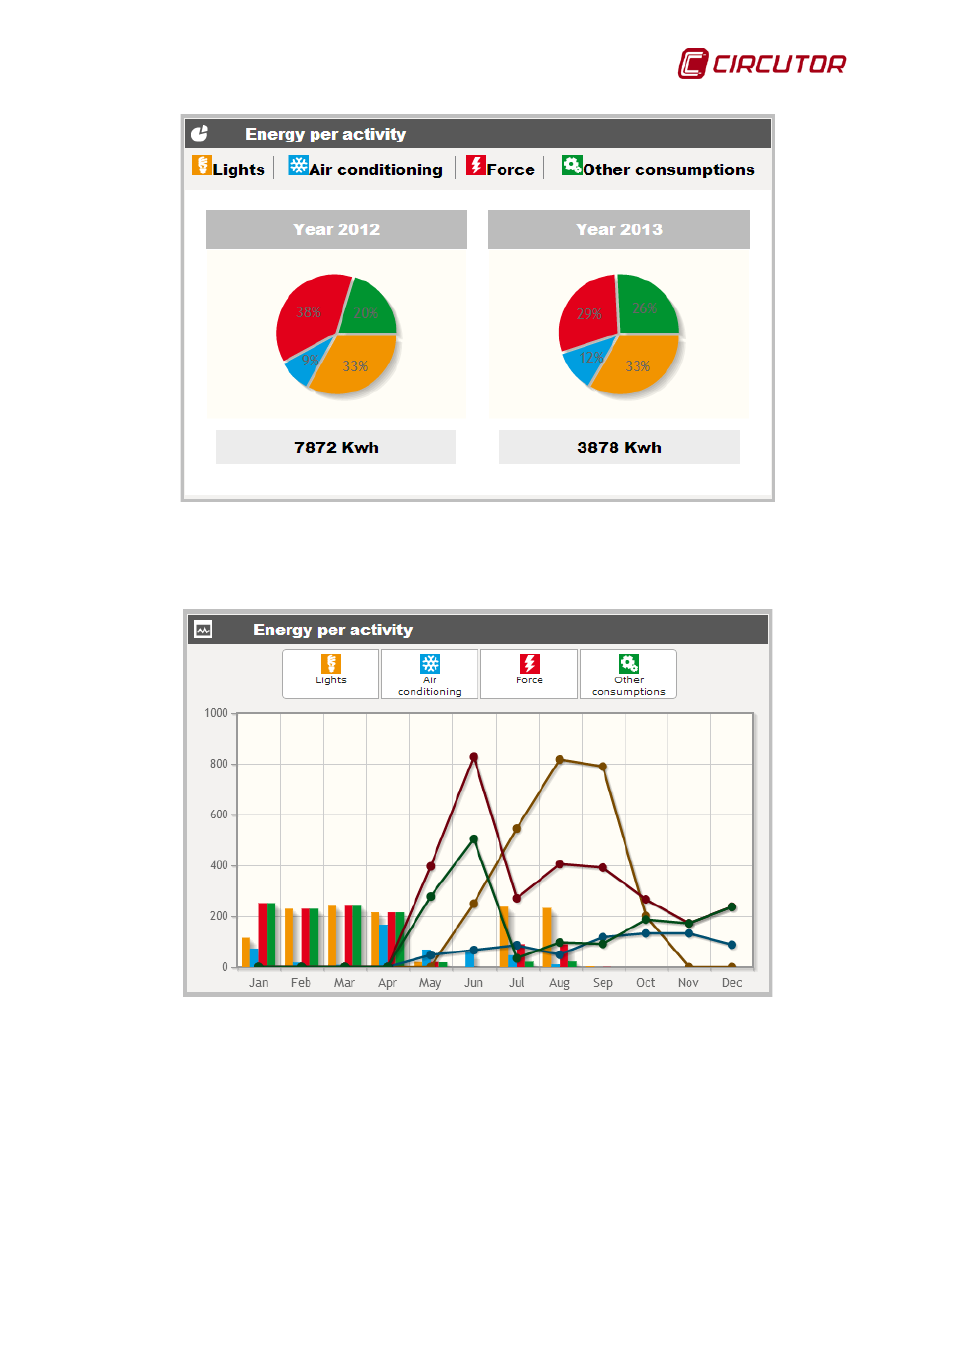
Circular annual graphic
On the other hand, the data of all variables added to the main graphic of energy by activity can
also be handled. On this graphic, the data of the previous year will be drawn in a line and the data of
the current year will be drawn on a bar.
Main graphic with all variables
Move the mouse over the point that you wish to view to show more details about the values
shown on the circular and main graphics.
In addition, you can select or deselect the variables to be displayed by clicking on the
corresponding button. In this case, deselect the ‘Air conditioning’ and ‘Force’ variables:
Advertising