6 graph properties, Graph properties – CIRCUTOR PowerStudio Series User Manual
Page 48
PowerStudio
48 User Manual
1.2.9.6 Graph properties
Many more aspects of the representation may be configured using the graph “Properties”
option. This option can be accessed using “Options” menu, "Properties" submenu, or directly through
the "Properties" button on the main toolbar.
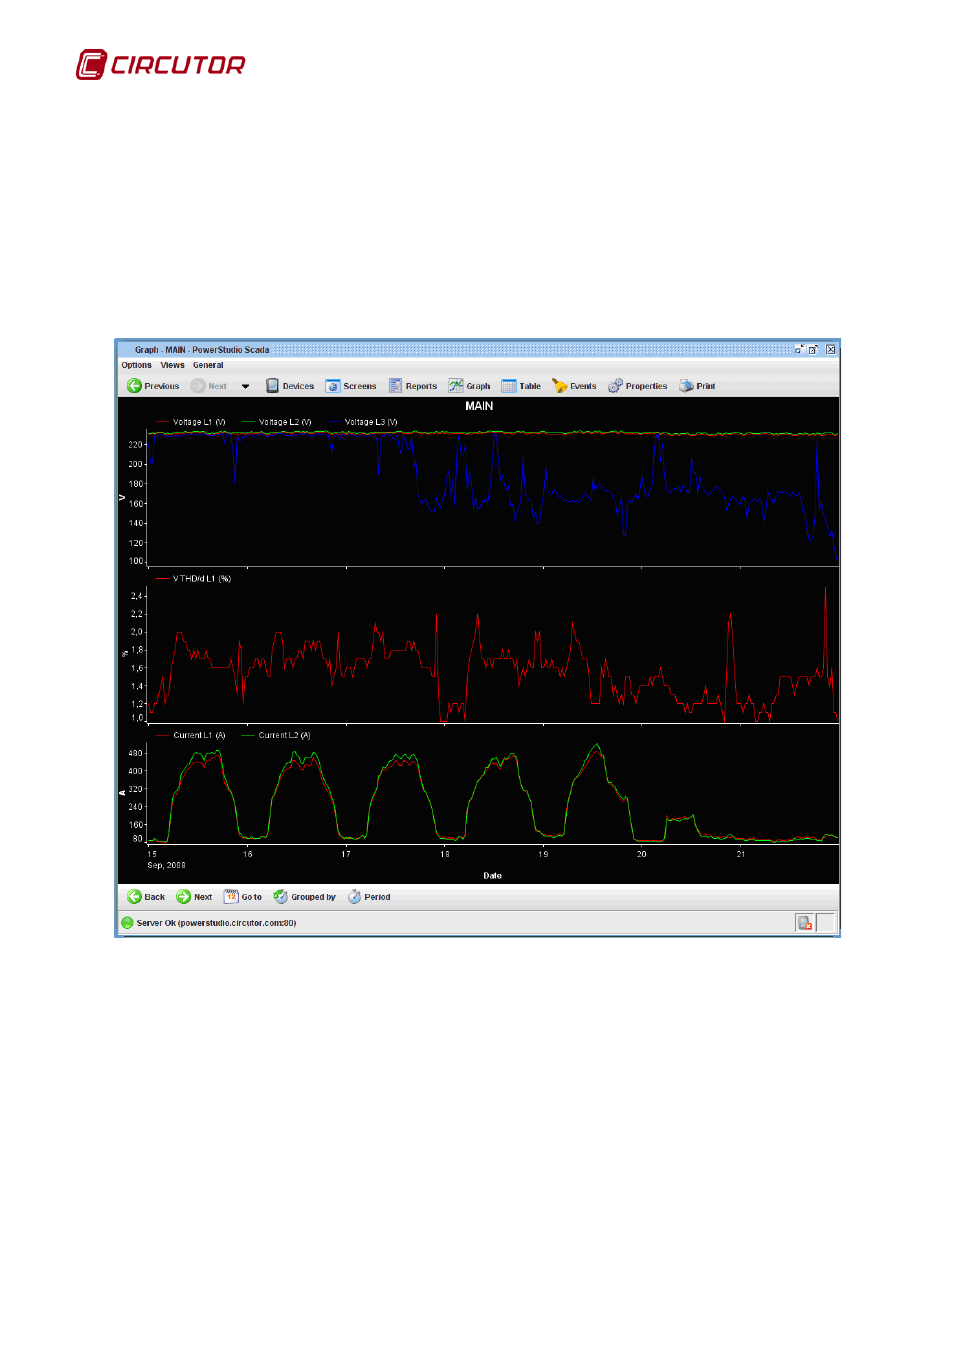
Suppose a graph is made of the variables of three voltage phases, the distortion in phase one,
and the current of phase one and two of the QNA measuring equipment. The client provides a view of
the graph with default configuration, namely a graph grouped as a week, set at the current week, with
30-minute periods, with three areas of representation (one where all three voltages are placed, another
where the distortion is placed and a final one where the two currents are placed) etc.
Graph with variables from a QNA
Change the graph properties by accessing the option previously indicated, and a window
similar to the following will appear: