CIRCUTOR PowerStudio Series User Manual
Page 70
PowerStudio
70 User Manual
As with the tables, the user can print the current graph page at any time using the “Print” option
in the “Options” menu of the main menu or the "Print" button of the upper toolbar.
It is also possible to export this table by clicking "Export" in the "Options" menu of the main
menu. It will be exported in text format, where each line of text is a row of the table and where each
column is separated by the symbol ";".The table may also be sorted by the various columns as desired,
for example, events may be sorted by duration, or even by type, and by the duration of each type as
explained above in the general table properties.
Note, however, that this type of table does not have a properties menu available that can be
used to configure it. However, the toolbar provides some extra options that permit a certain degree of
configuration for this type of table.
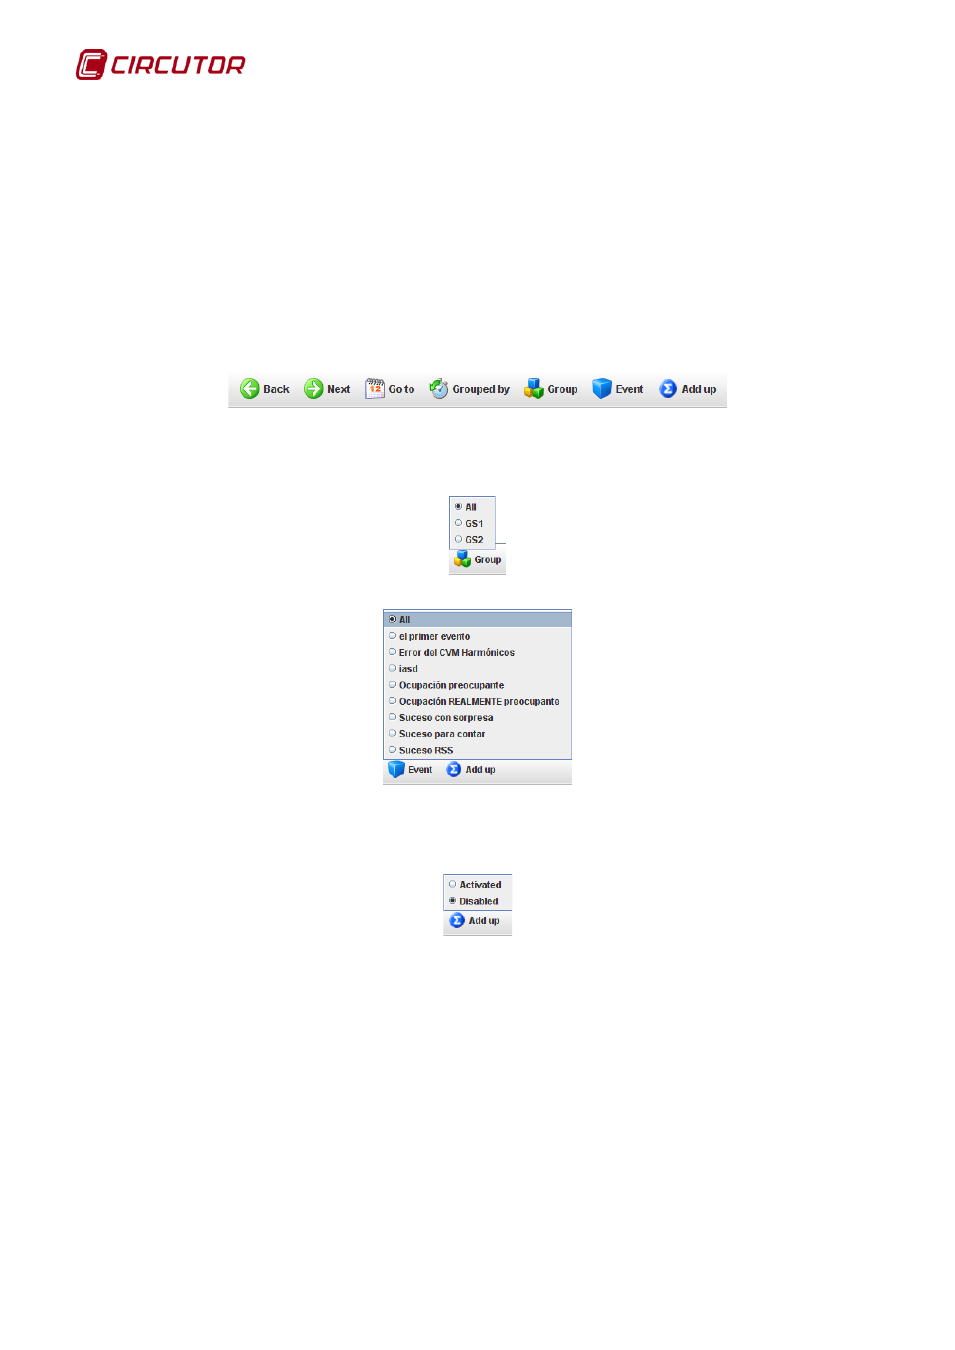
Logged events table toolbar
There are a couple of options that permit desired events to be filtered according to the group
they belong to or according to a specific event.
Filtering events by group
Filtering events by individual event
The latter option permits changes to the display mode. Thus, the total mode may be enabled or
disabled.
Change the display mode by enabling or disabling the total view
Activating the total view produces the following list: