CIRCUTOR PowerStudio Series User Manual
Page 54
PowerStudio
54 User Manual
The axes of a graph can also be configured using the properties window. In this window, click
on the axis to be configured and the following window will appear:
Shaft configuration window
This window allows the limit values of the axis in its Y-coordinate to be set. By default the
graphic engine set limits which enable all the values of a variable to be shown. However it is possible
to modify them manually using this option. In the example the minimum Y limit value of the axis where
the voltages of the phases are zero will be set.
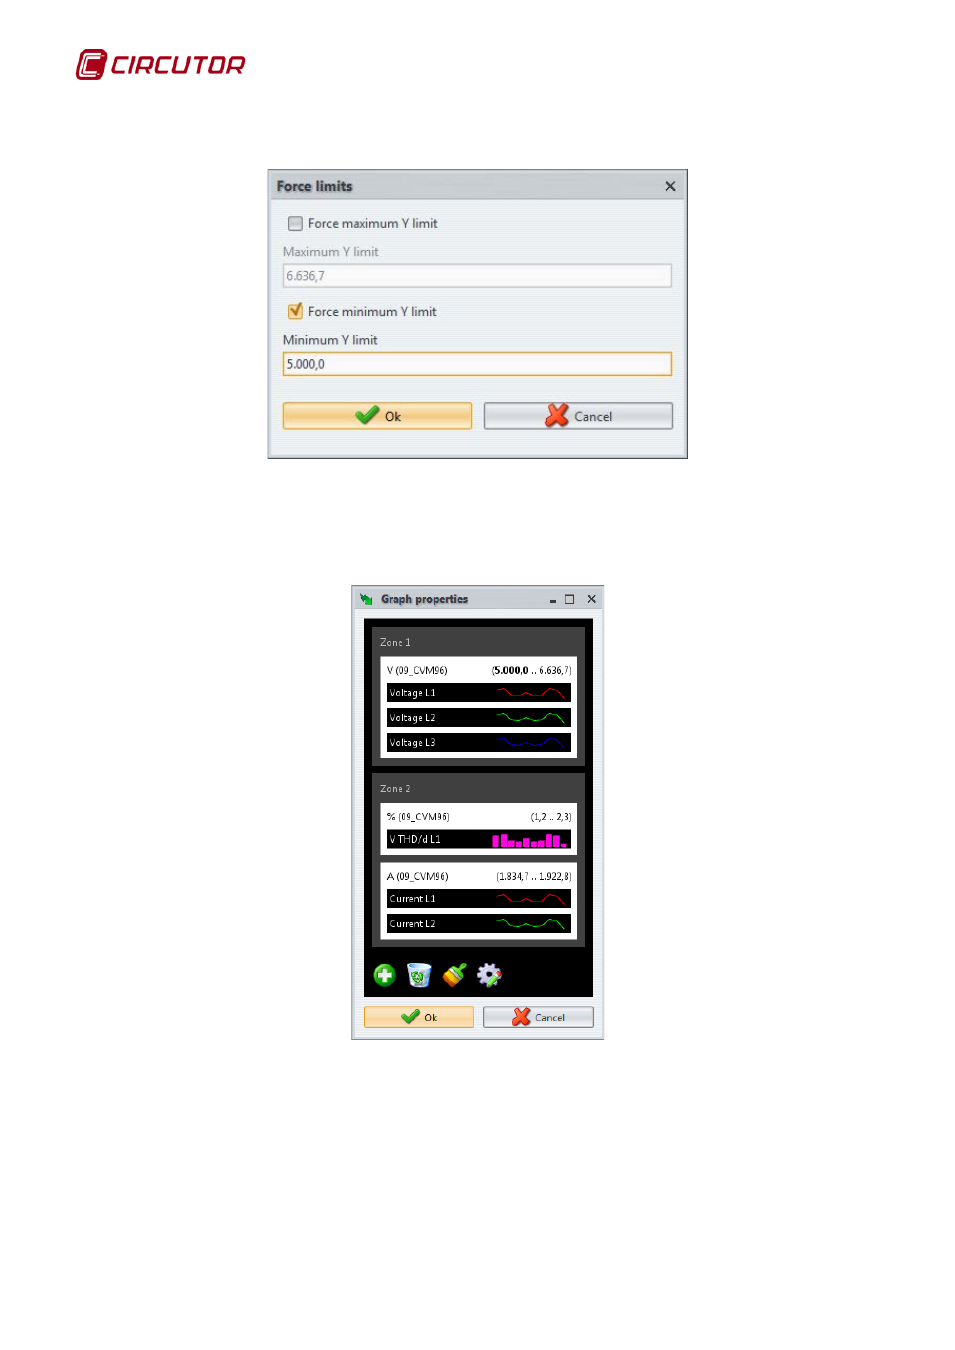
Forced axis minimum limit properties
Note that in axis properties the units may be seen, as well as the equipment they belong to
between parentheses (provided the variables are from only one device), and the Y-axis limits
(minimum and maximum value, in bold if this value is forced by the user).
Like variables, axes can redistributed using the drag and drop method. The operation is the
same as dragging and dropping a variable. So, one axis can be dropped on another with the same unit
type, on another area (or on the same area but in another position), or "outside" in the trash (deleting
all the variables it contains).