5 toolbar, Toolbar – CIRCUTOR PowerStudio Series User Manual
Page 46
PowerStudio
46 User Manual
Another possibility is to vary the size of the square area around the cursor. This can be done
with the mouse wheel or, if the mouse does not have this feature, by using the “+” keys "(greater
square area) and" - "(smaller square area).
1.2.9.5 Toolbar
The graphs always have a toolbar at the bottom that allows a series of actions related to the
data to be shown.
Toolbar of a typical graph
The typical options available in the toolbar are:
• Back: Displays the previous interval of data. Typically, the range of previous data is a function
of data grouping and, if grouped by days, upon going to the previous interval the previous day's
data is displayed. There are types of graphs where grouping does not make sense, because
they are displaying values of a specific date (for example in QNA harmonics graphs), clicking
on this option in this case displays the next date immediately following that contains data.
• Next: Displays the next interval of data. Typically, the interval of data following this is based on
the data grouping and, if grouped by weeks, upon going to the following interval data from the
following week is displayed. There are types of graphs where grouping does not make sense,
because they are displaying values of a specific date (for example in QNA harmonics graphs),
clicking on this option in this case displays the next date immediately following that contains
data.
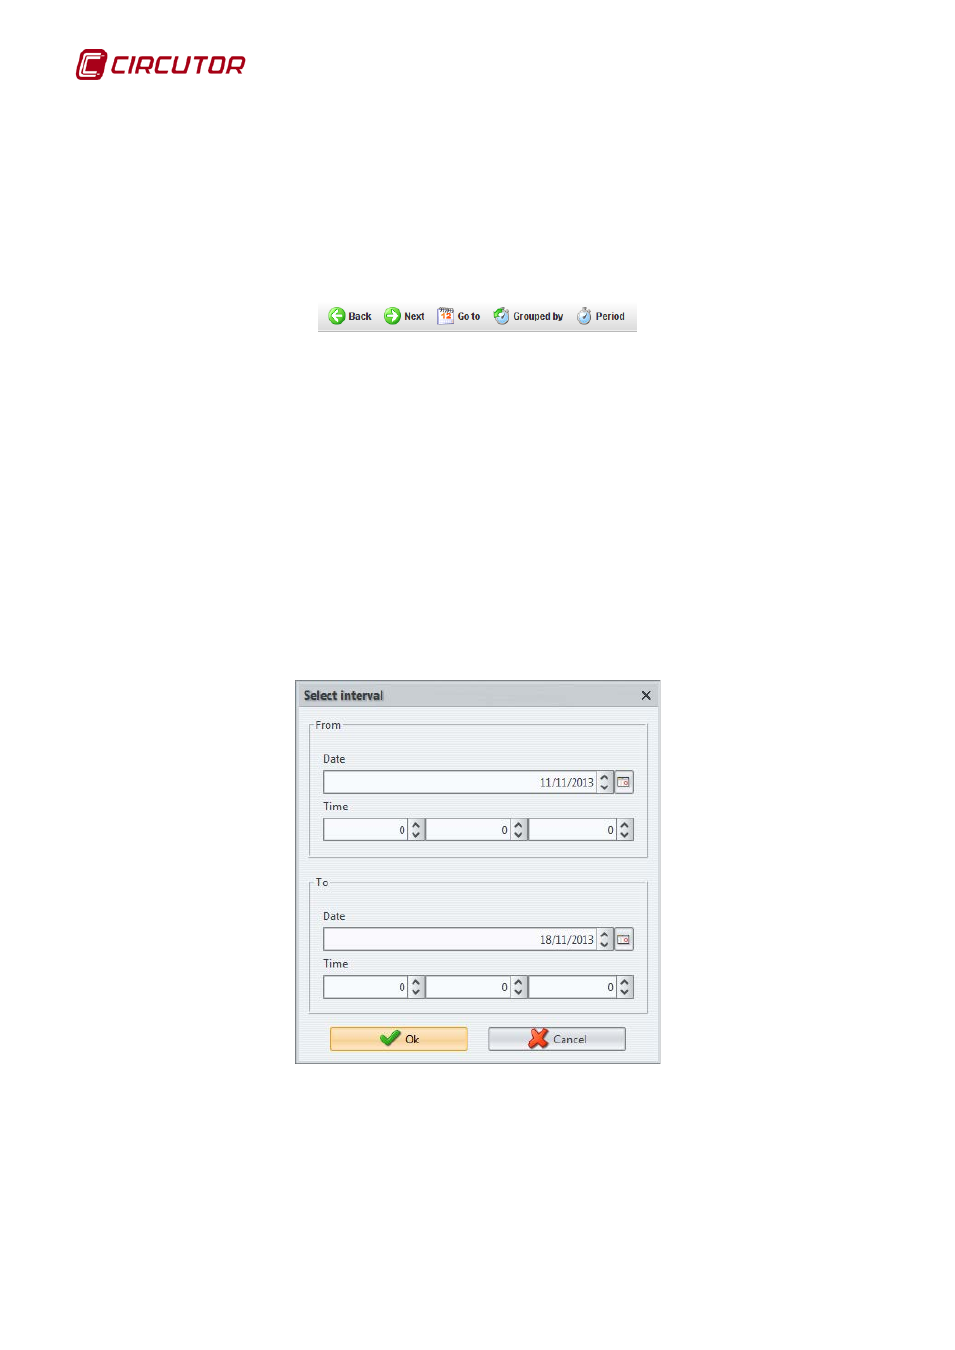
• Go to: Displays data within a user-defined time interval. There are graphs where it makes no
sense to specify an interval (graphic harmonics in QNA), and this permits indication of the
exact date desired.
Display data Interval selection dialogue