3 dashboard, Dashboard – CIRCUTOR PowerStudio Series User Manual
Page 83
PowerStudio
User Manual 83
1.3.3 Dashboard
The dashboard is the main screen of the HTML5 client. This will be the default display when
the client is accessed and it will show summarised information of the application.
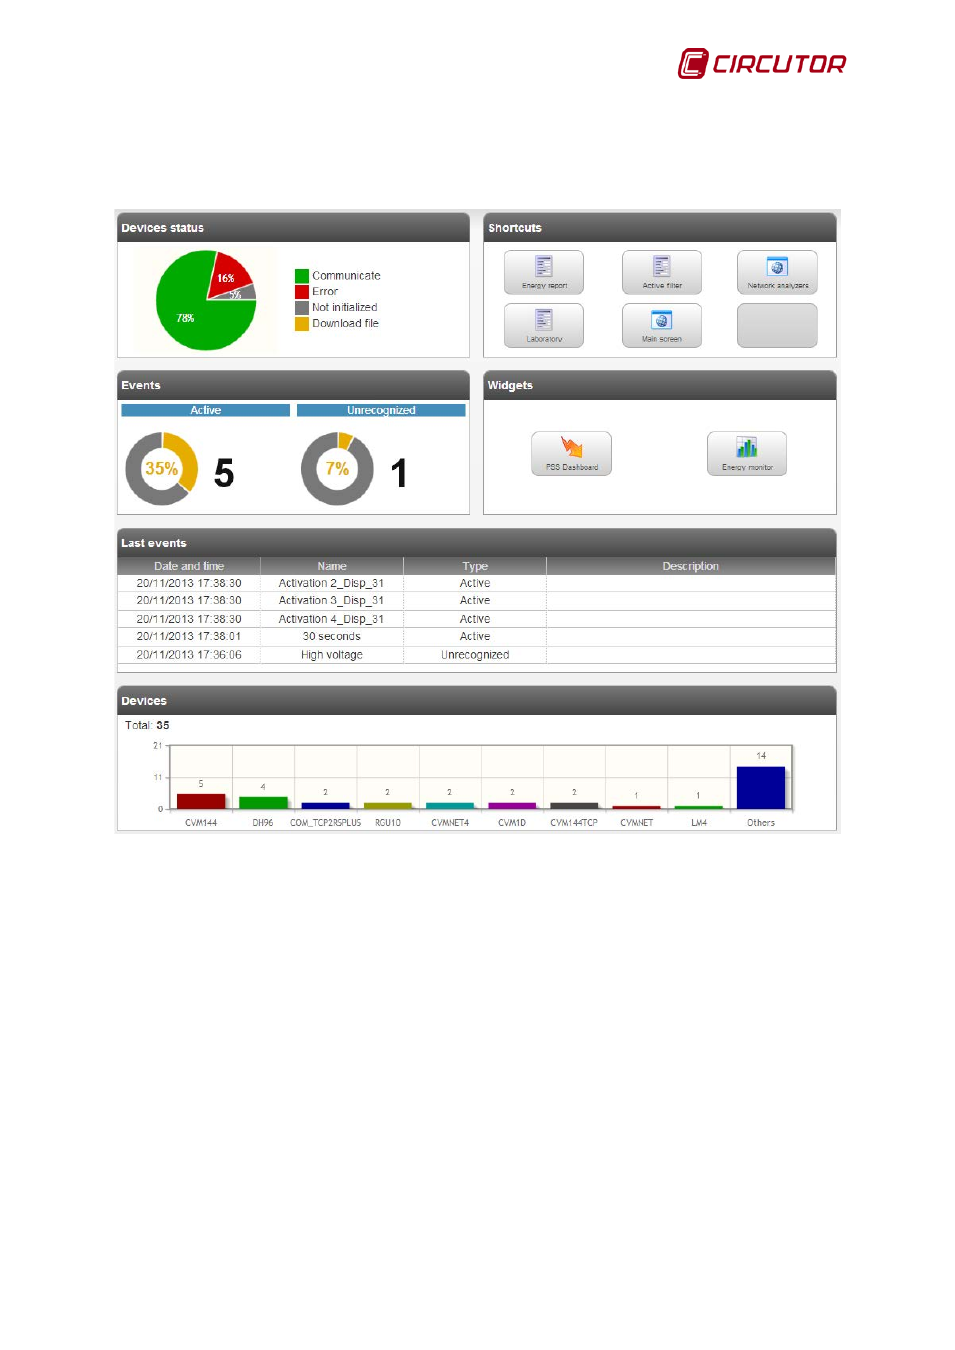
Dashboard
This screen shows the following sections:
• Device status: Shows a circular graphic with the status of the units. Possible states are:
communicating, error, not initialised and downloading file.
• Shortcuts: Shows the last screens and reports that have been opened. Click on a shortcut to
access these screens and reports without having to search for them again.
• Events: Shows two circular graphics: an active event graphic and a graphic for events that
have not been acknowledged. The percentage is calculated with the total number of events.
• Widgets: Shortcuts to the PowerStudio widget and energy monitor.
• Last events: Shows a list of the last events with their date, name, type and description.
• Devices: Shows a bar graphic with the units, arranged by type of device.