Chart screen – Super Systems 9120 with TS User Manual
Page 41
SSi 9120 Touchscreen Interface
4586 – 9120 With Touch Screen Interface
Page 41 of 80
Chart Screen
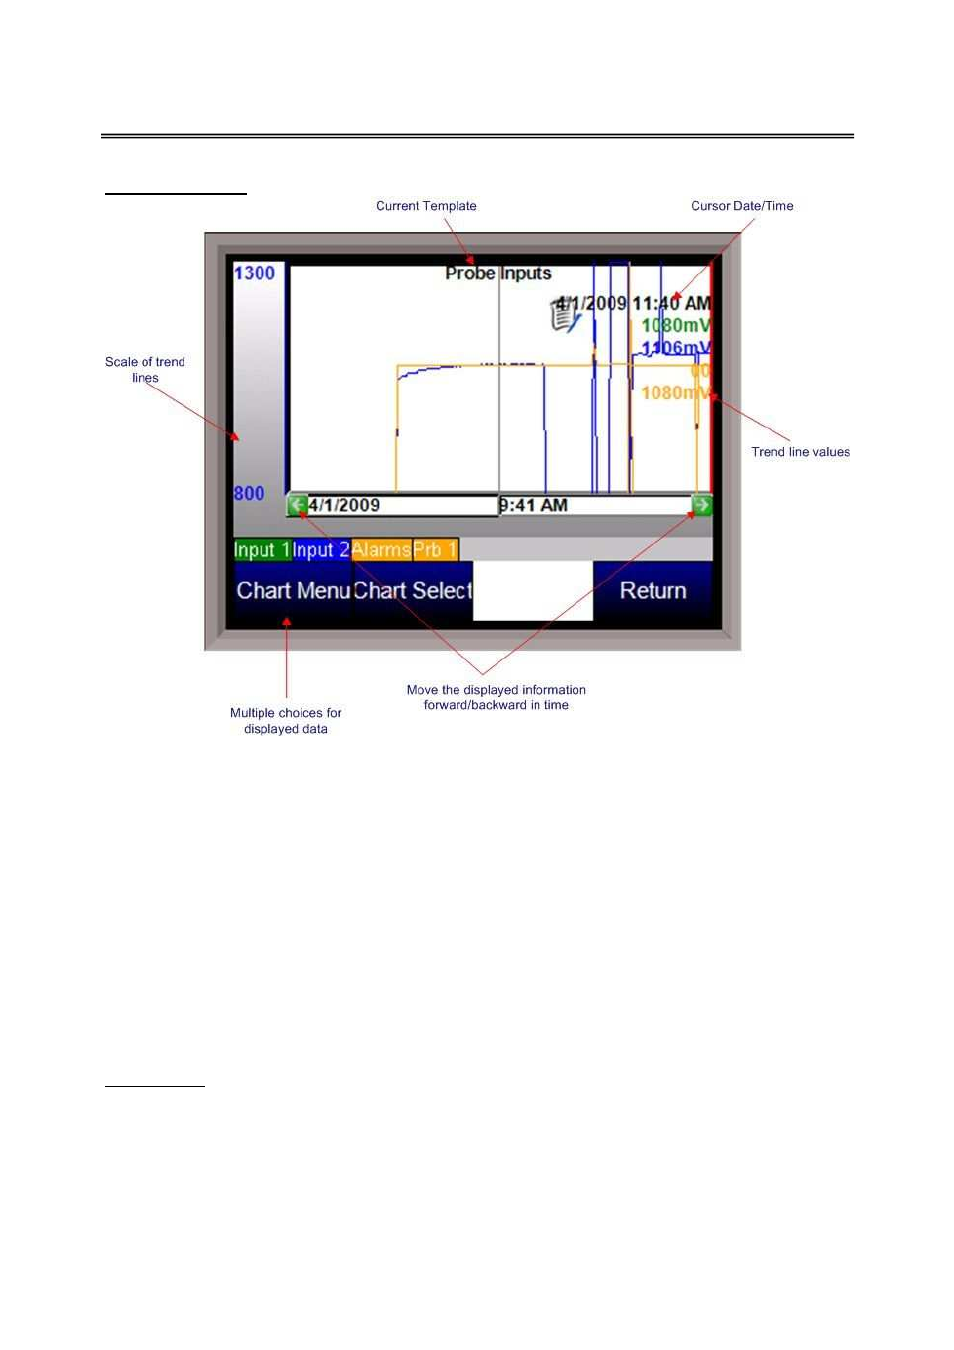
The Chart Screen will display the trend lines for the selected trend chart. The chart can be
viewed either in real-time mode, or in historical mode. The left side of the screen will display the
selected trend line’s scaling, as set up in the
Edit Trend Chart
section of the
Configuration
menu.
A trend line’s scaling, name, and data will all be in the same color for ease of viewing. Pressing
the scale bar (left side of screen – “Scale of trend lines” on image) will allow the user to cycle
through the available trend scales. Even though multiple trend lines will have different scales, the
lines will all be displayed on the same screen. The trend chart’s name will be displayed at the top
of the screen. The red vertical line is the chart’s cursor. In realtime mode, the cursor is at the
far right of the screen. The cursor can be moved by pressing on it and moving it left or right.
Moving the cursor will display the trend values for the selected time. The chart can also be
panned by pressing the green arrows to move forward or backward by the selected sample rate –
2 hours, 4 hours, etc. Pressing the trend names that are on top of the menu buttons will enable
or disable the trend lines on the chart. This is useful if the user wishes to only view one or two
trend lines on the chart. Disabled trend names will be in gray.
Chart Menu
The chart menu button will display more options for the displayed data. Note – The Chart Menu
can also be displayed by pressing on the chart area for a couple of seconds. The options are:
•
Realtime
•
Sample