Super Systems 9120 with TS User Manual
Page 39
SSi 9120 Touchscreen Interface
4586 – 9120 With Touch Screen Interface
Page 39 of 80
Each trend will have the same number of fields to be filled out when adding or editing. The
“Name” is merely the name of the trend. This is how the trend will be identified on the chart
screen. It will also be the physical name of the trend chart file. The list of values in the “Data”
list are the specific registers that are being data logged. This list can be modified in the
Edit
Datalogger
section that follows this section. Select the register that corresponds to the desired
point to view. The “Min” field is the minimum display value for the chart. The “Max” field is the
maximum display value for the chart. The “Expression” field will format how the data value will
be displayed on the screen. To display the data value as it is, enter an “x” as the expression.
Note – Data values are stored in the 9120 without any decimal places, so formatting will be
necessary for some values
. If the data value was monitoring % Carbon, then the expression
would be “x * 0.01”, since % Carbon values will need decimal places shown on the display. The
“Format” field will control how the data value is displayed. This field works with the “Expression”
field for display purposes. To display the data value as it is, enter a “0”.
Note – Data values are
stored in the 9120 without any decimal places, so formatting will be necessary for some values
.
If the data value was monitoring % Carbon, then the format would be “0.00”, since % Carbon
values will need decimal places shown on the display.
The following example will illustrate the difference between “Expression” and “Format”. Assume
that the data value represents a % Carbon value, and it’s value is 3.47. This will be saved in the
9120 register as 347. Assume that “Expression” is set up as “x * 0.01” and “Format” is set up as
“0.0”. Whenever the data value is logged, it will be logged as 3.47, but it will display 3.8, since
the “Format” only allows for 1 decimal place. If “Format” was “0.00”, then the data value will
display 3.47. However, if “Expression” was “x * 0.1” and “Format” was “0.0”, the data value
would be logged as 34.7 and display 34.7. If the “Format” was “0.00”, the data value would be
displayed as 34.70.
The color next to the “Format” field will allow the user to select which color the trend line will
show up as on the chart.
The “Units” field will be the description of what kind of data value is being logged. This can be
any value, such as “°F”, or “%C”, or “mV”.
The “Line Width” field will allow the user to set the thickness of the trend line on the chart.
Lower numbers equal thinner lines, and higher numbers equal thicker lines. This may come in
handy if both actual temperature and temperature setpoint have the same color. Actual
temperature can have a line width of “1”, and temperature setpoint can have a line width of “2”.
This will allow similar trends to be grouped by color.
The “Sample” field will allow the user to test out if the formatting of the trend line is correct.
Enter a value in the number box and click on the Test button. The “Result” label will display the
result based on the formatting selected.
Click on the Set button to save the trend line’s
values. Click on the Cancel button to not save
any of the changes made.
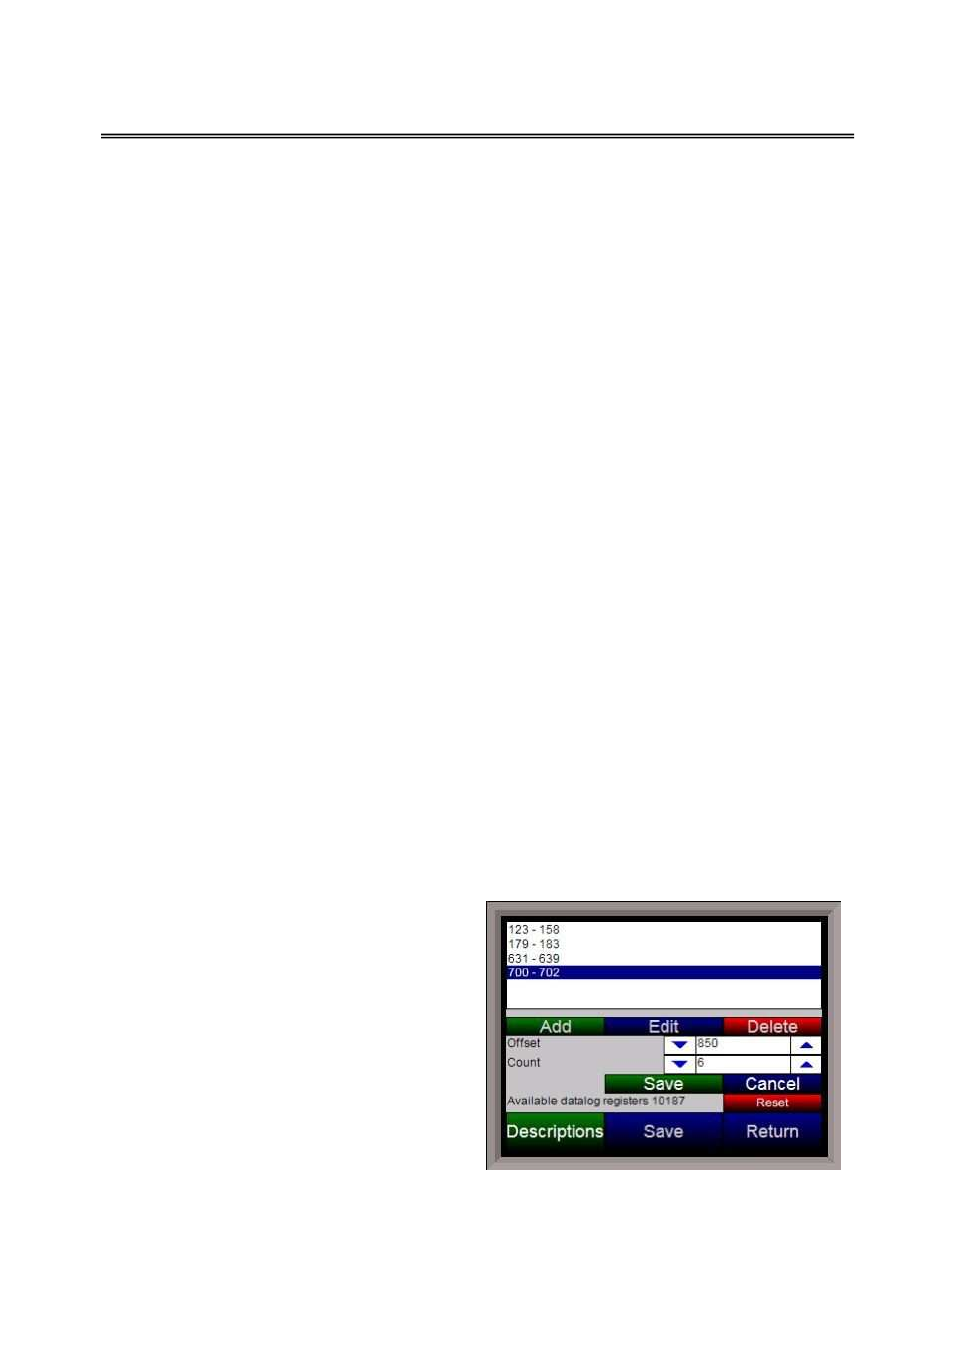
Edit Datalogger
Note – Contact Super Systems before making
any changes on this screen, since any changes
made can have an adverse effect on the data
being displayed
.
This menu option will allow the user to modify
which registers in the 9120 will be used as
datalog data.