Waterfall, Sonagram – Wavecom W61PC V7.5.0 User Manual
Page 80
70
Analysis Tools
WAVECOM Decoder W61PC/LAN Manual V7.5
Options can be set using the right mouse button or the context menu (see “
” on page 59). It is possible to remove the tuning FFT or Sonagram in the View Menu.
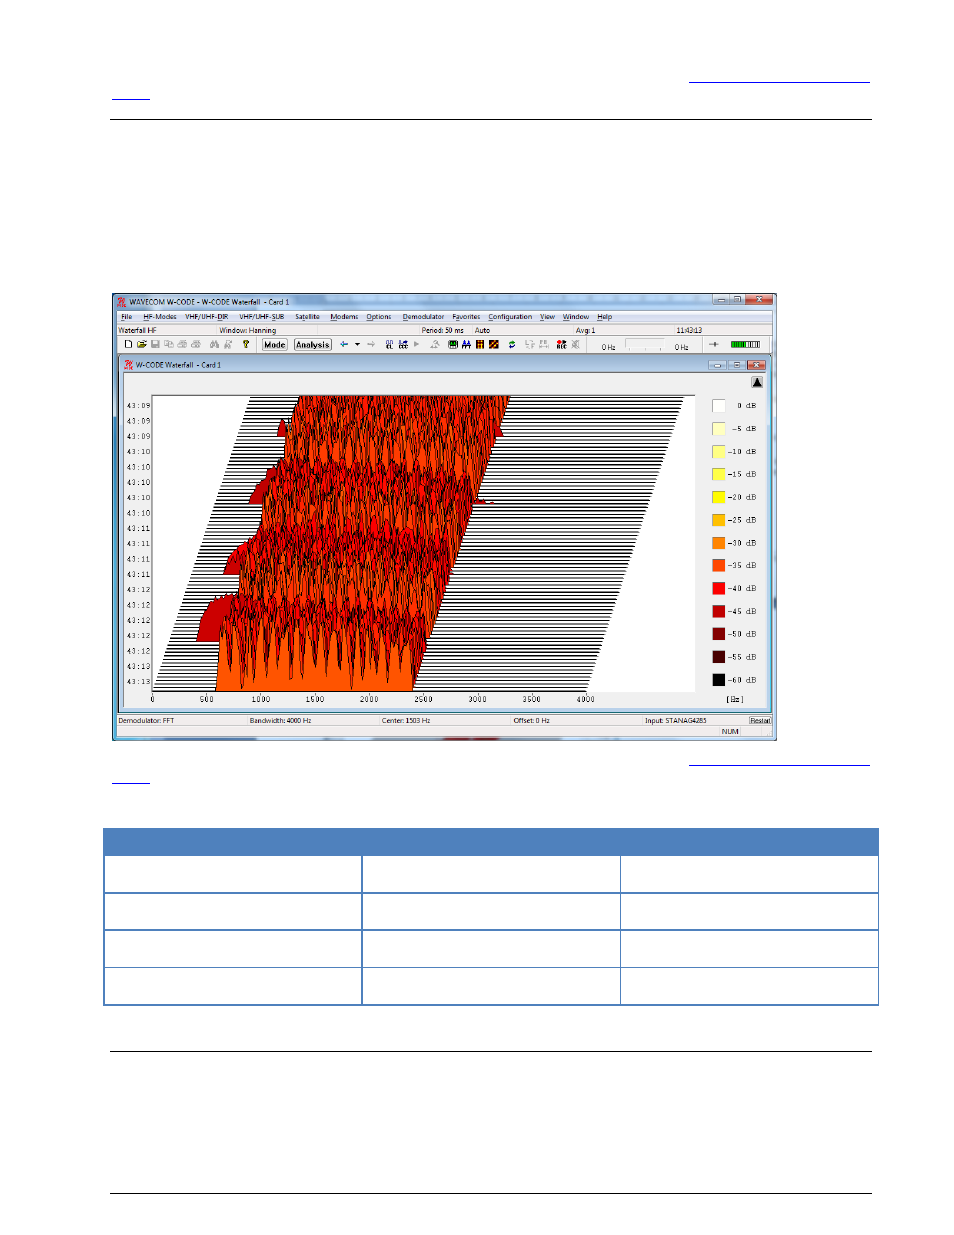
Waterfall
The waterfall analysis produces a three dimensional display of FFT spectra over time, frequency and am-
plitude. The waterfall display aggregates many single measurements to 40 displayed spectra. An updated
measurement in the two-dimensional real-time FFT display only shows a fraction of the data, depending
on the modulation method. In contrast the FFT waterfall display also displays data in the time domain
A time histogram is displayed on the left-hand side of the display.
By clicking on the graph, the display will be paused and measurement cursors appear.
Options can be set using the right mouse button or the context menu (see “
” on page 59). It is possible to remove the tuning FFT or Sonagram in the View Menu.
Waterfall HF, Waterfall SUB, Waterfall DIR, Waterfall SAT
FFT Type
Start Frequency
End Freqeuncy
Waterfall HF
Offset Frequency
Bandwidth
Waterfall SUB
Offset Frequency
Bandwidth
Waterfall DIR
Offset Frequency – Bandwidth/2
Offset Frequency + Bandwidth/2
Waterfall SAT
Offset Frequency – Bandwidth/2
Offset Frequency + Bandwidth/2
Sonagram
A second widespread method for FFT display is the real-time sonagram, which displays the amplitude and
frequency values produced by the FFT over time. In the sonagram, the signal amplitude is displayed by
colour, with different colours representing different amplitudes. Sometimes this display is also called
“Spectrogram”.