Data status graph – Wavetronix Command Collector (CMD-DCx) - User Guide User Manual
Page 53
52
CHAPTER 5 • SENSOR CONFIGURATION PAGE
view of the interval status graph, reload the page using the web browser’s Refresh button
or the F5 key.
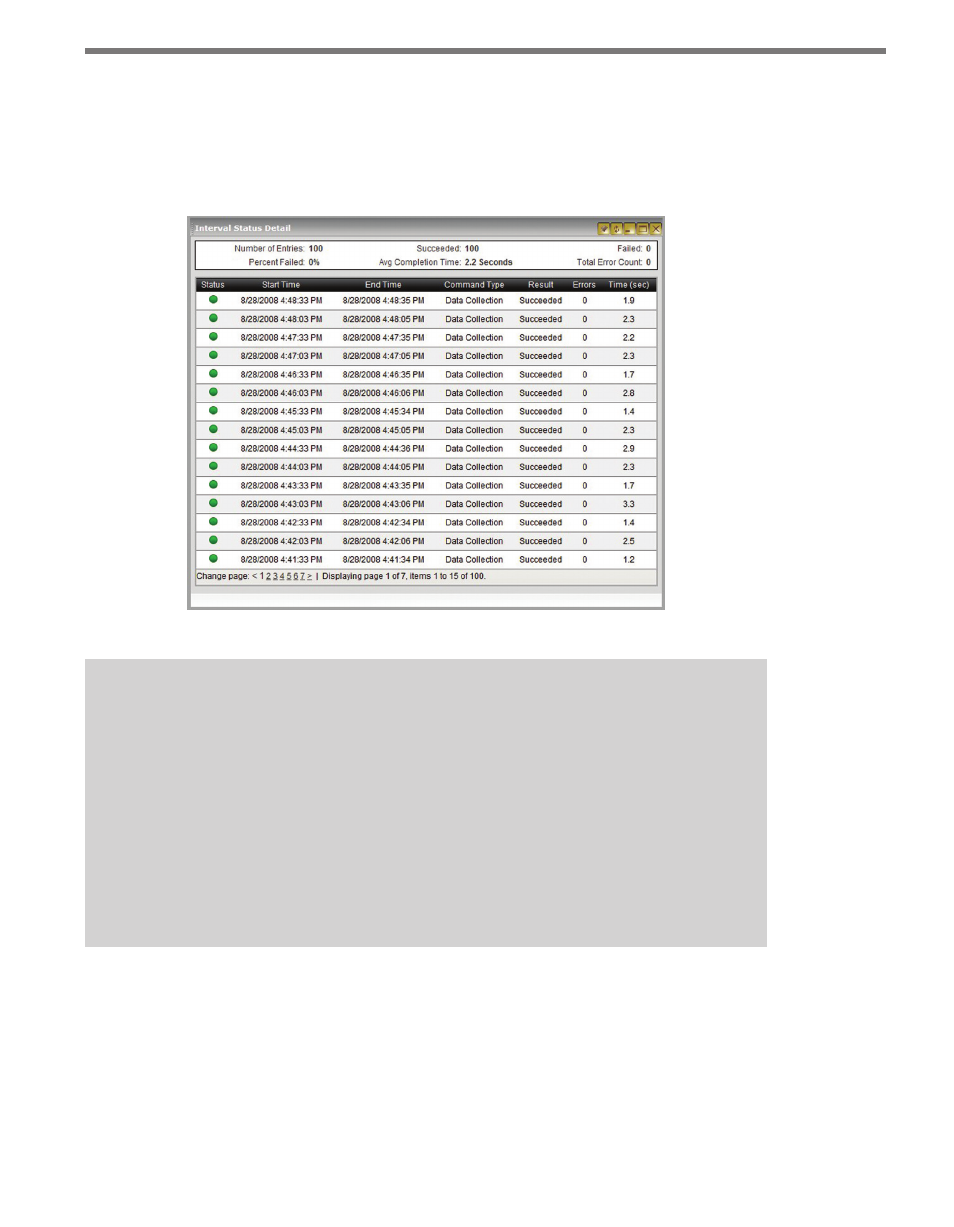
Clicking on the interval status graph opens the Interval Status Detail window, which dis-
plays the time and result of each connection attempt (see Figure 5.3).
Figure 5.3 – Interval Status Detail Window
Note
A red bar in the interval graph does not necessarily mean data was not collected for
that interval. Most Collector drivers are designed so that upon making a communica-
tion link with a sensor, they go back and fill in any gaps in the data caused by previous
communication errors. Therefore, a red interval may not have recorded data at that
time, but the following green interval (if any) may have been successful in grabbing
both the current data packet and the previous data packet from the red interval. An
analysis of the sensor data, using the validation report, through a data query or by
other means, will be necessary to evaluate data collection and to determine whether
there are still holes in the data due to communication or device errors.
Data Status Graph
The data status graph allows you to determine if data is being properly collected. The graph
displays one entry for each of the 100 most recent data intervals. Click anywhere on the
graph to view details about each interval (see Figure 5.4).