Data query tables – Wavetronix Command Collector (CMD-DCx) - User Guide User Manual
Page 65
64
CHAPTER 5 • SENSOR CONFIGURATION PAGE
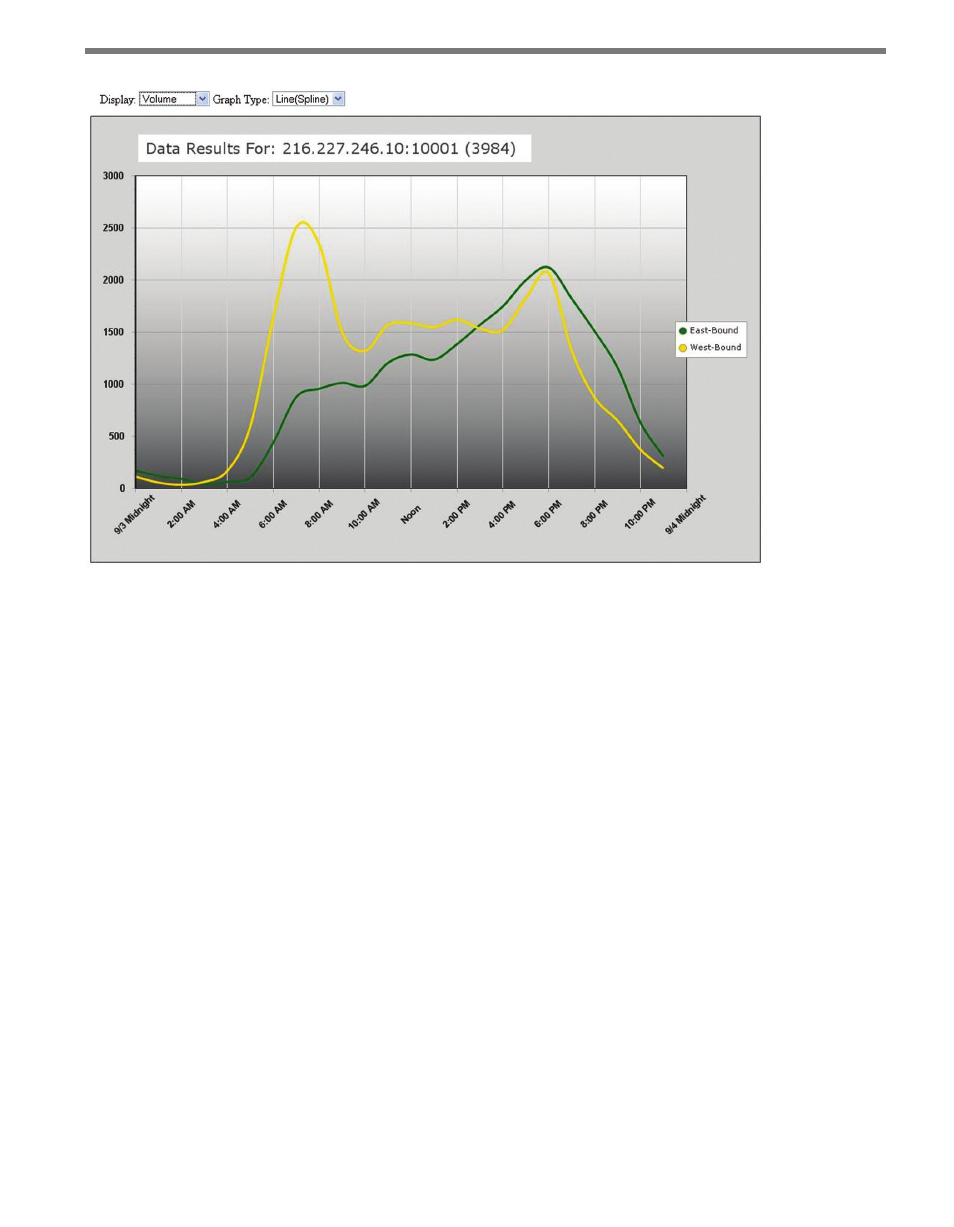
Figure 5.14 – Data Query Graph
Depending on the Group By option selected when performing the query, there will be be-
tween one and sixteen different graph lines representing the different lanes or approaches.
To switch graph views, select a new data field from the Display drop-down list on the top
left of the graph. Selecting a new view will redraw the graph using the new data field. Each
sensor type has its own data format with different data fields for display. The data fields
available for display depend on the driver.
You can also use the Graph Type drop-down menu to switch between Line (Spline) and
Line (Point) graphs.
Most Web browsers also make it easy to save graphs as image files for future reference.
Right-click on the graph and select Save Image As… or Save Picture As… to save the
graph as an image file.
Data Query Tables
Selecting the Table output format option when performing a data query will open a data
query table in a new browser window (see Figure 5.15).