Wavetronix Command Collector (CMD-DCx) - User Guide User Manual
Page 85
84
CHAPTER 7 • SYSTEM PAGE
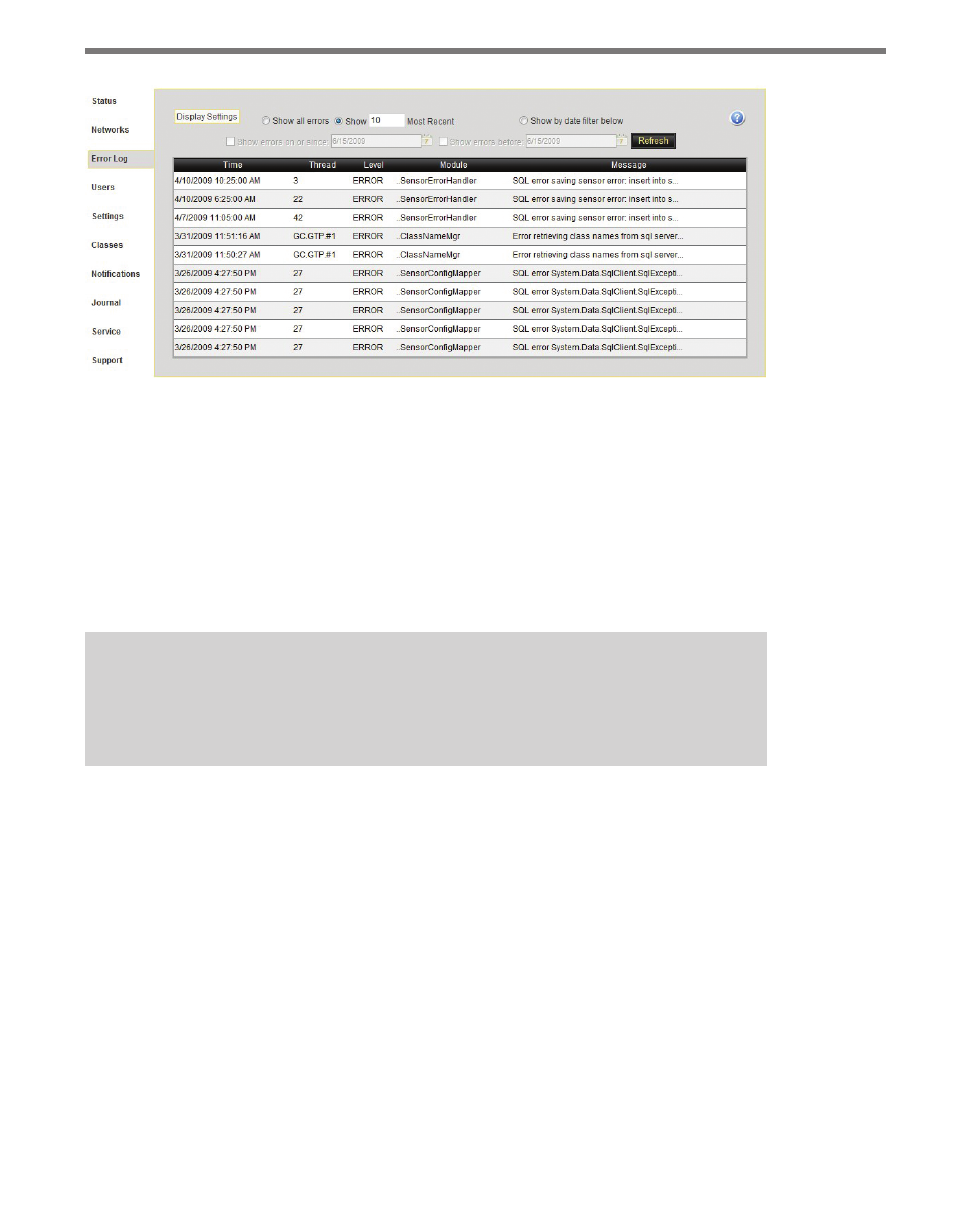
Figure 7.4 – Error Log Tab
The error list contains the following five columns:
˽
Time – Shows the date and time the error was recorded.
˽
Thread – Shows the name of the thread that recorded the error.
˽
Level – Shows the classification of the error (CRITICAL, ERROR, WARNING and
INFO). Displayed error levels can be adjusted using the Settings tab.
˽
Module – Shows the individual Collector module that recorded the error.
˽
Message – Shows an abbreviated form of the error message recorded by Collector.
Note
The Thread and Module columns may be useful to know during Wavetronix cus-
tomer support debugging.
In cases where the error message is too long to be displayed in the Message column, clicking
on a row in the error list will cause a sub-window with the entire error message to appear.
The system error list can be sorted by clicking on a column header.
The Display Settings control in the left corner allows you to change how many rows of
system errors are displayed per page and to toggle the visibility of each of the five columns
for customized display.
You can also filter system errors by selecting a filter option above the error list. The Show
Most Recent option allows you to display a desired amount of errors. The Show errors on
or since option allows you to show all errors from any given date until the present using the
calendar control.