Status tab, Networks tab, Server information and status – Wavetronix Command Collector (CMD-DCx) - User Guide User Manual
Page 83: Server status graphs
82
CHAPTER 7 • SYSTEM PAGE
Status Tab
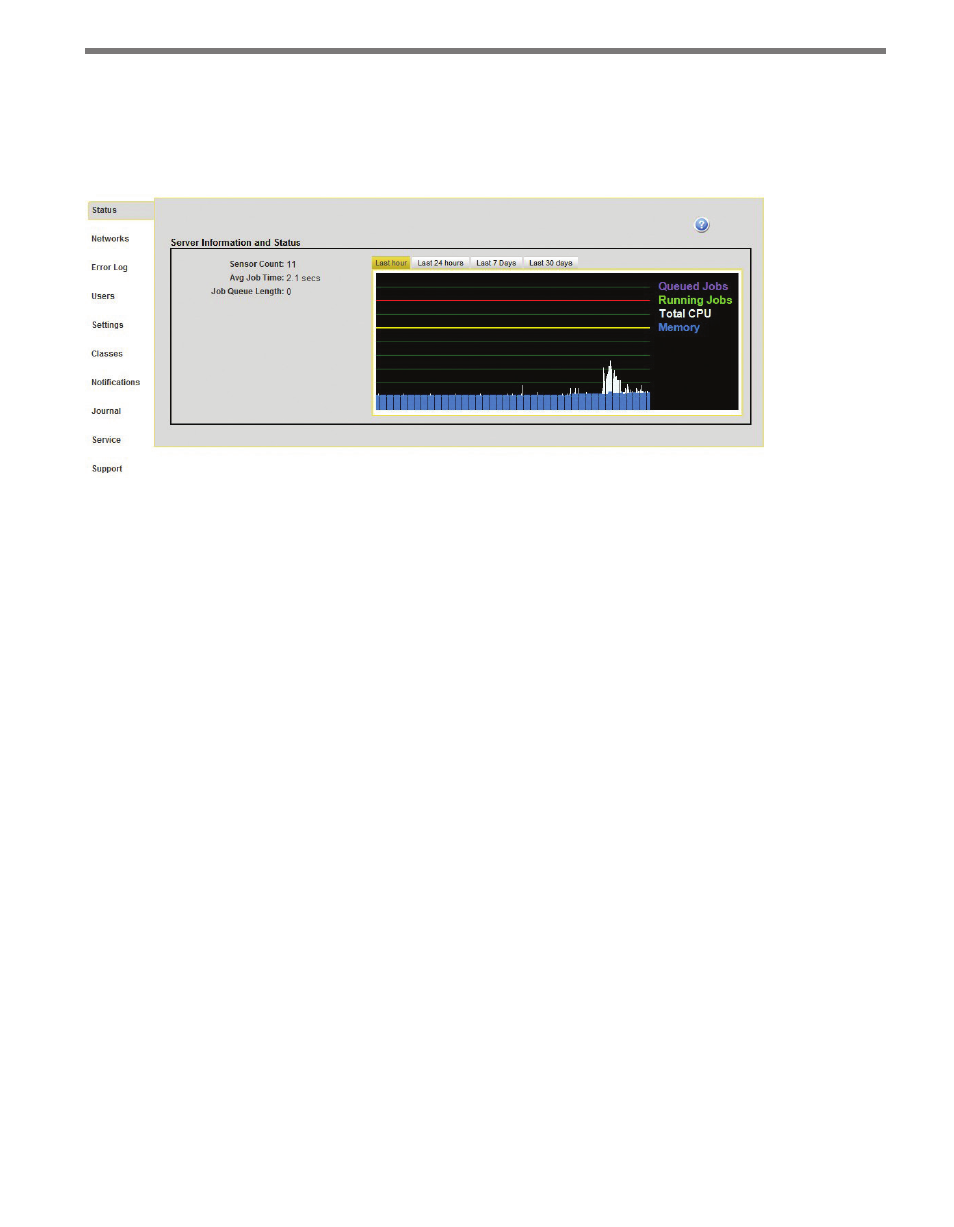
The Status tab allows you to see the current status of any server in the Collector system (see
Figure 7.2).
Figure 7.2 – System Status Tab
Server Information and Status
The Server Information and Status box contains the following information about server
status and configuration:
˽
Sensor Count – Shows the total number of sensors assigned to this server.
˽
Average Job Time – Shows the average time for this server to complete each data col-
lection job (or other sensor-related jobs) for all its sensors.
˽
Job Queue Length – Shows the current number of jobs waiting in the queue for execu-
tion; high numbers may indicate an overloaded server.
Server Status Graphs
The status graphs show current server status and contain a graphical composite of memory
usage, CPU usage, queued jobs, and currently running jobs. Graphs can be displayed for
the previous hour, day, week, or 30-day period to visualize server status trends over time.
Networks Tab
The Networks tab allows you to create, edit, and delete sensor networks within Collector
(see Figure 7.3).