Data query graphs – Wavetronix Command Collector (CMD-DCx) - User Guide User Manual
Page 64
CHAPTER 5 • SENSOR CONFIGURATION PAGE
63
provided aggregation intervals.
4 Include the desired approaches (optional). By default, data queries will run queries
over all lanes. To exclude one or more lanes from the data query, uncheck the approach
in the Include Approaches list.
5 Select how the sensor should be identified in the output by using the Show Sensor By
option. Use the drop-down menu to choose to show the sensor by IP/Port, Location/
Description or Custom ID.
6 Select the timestamp format. Data queries can have the data timestamps set to be at the
beginning of the data interval (Collector default) or at the end of the interval.
7 Select what you would like to do with the gaps in data. You can either select to Do
Nothing or Fill In Gaps With Zeroes.
8 Select the output format. Data queries can be output in graph, table, text and XML
format. Select the desired output form (more than one output format can be selected
at the same time).
9 Click the Run Data Query button. Data queries may take as long as a few minutes de-
pending on the size of the query. The output will be shown once processing is complete.
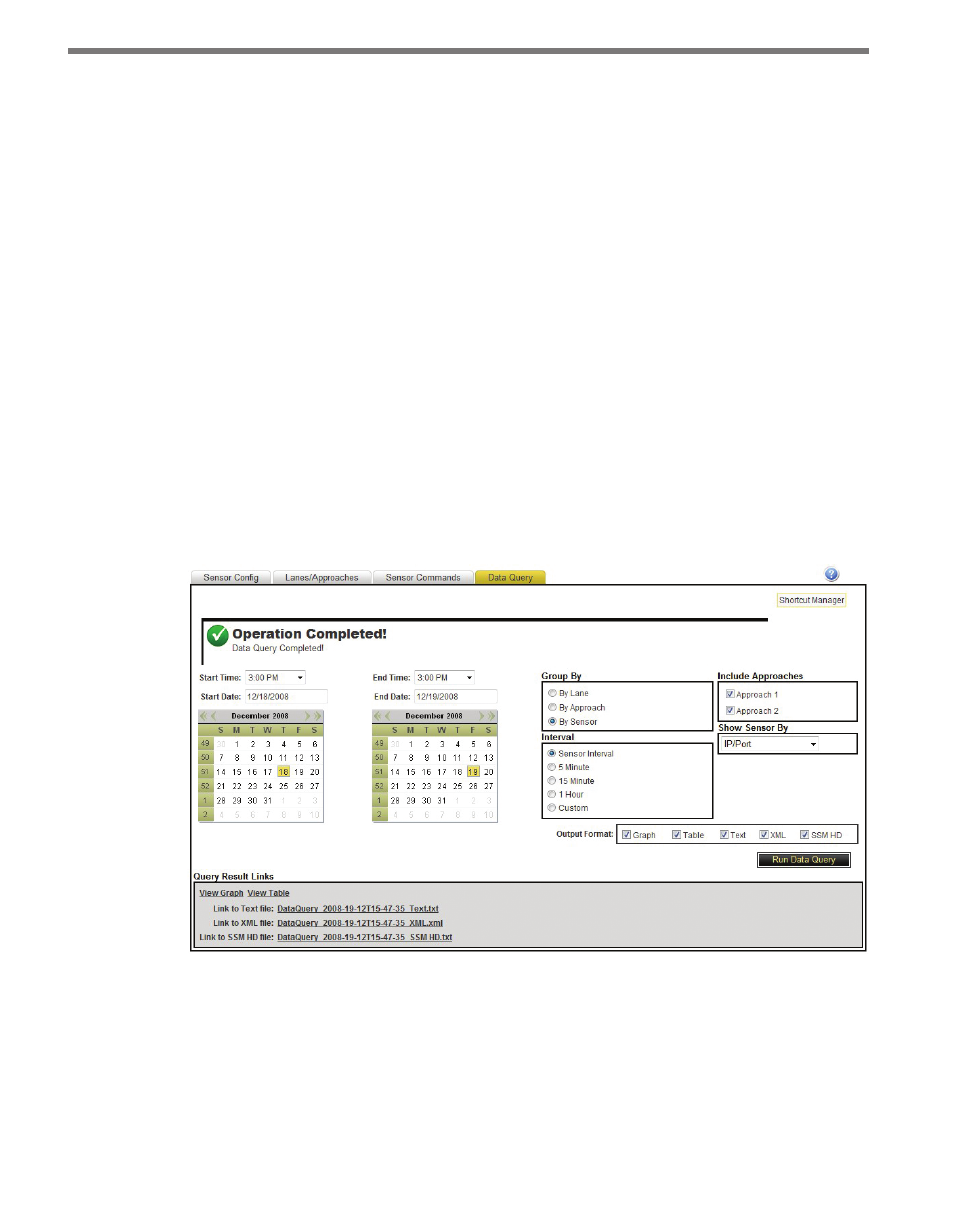
Links to all queries will appear at the bottom of the Data Query tab (see Figure 5.13). These
links can be opened in a browser window and/or saved to your local machine.
Figure 5.13 – Query Result Links
Data Query Graphs
Selecting the graph output format option when performing a data query will open a data
query graph in a new browser window (see Figure 5.14).