7 embedded graph control, Embedded graph control – CIRCUTOR PowerStudio Series User Manual
Page 36
PowerStudio
36 User Manual
5.2.1.7
Embedded Graph Control
Use this tool to embed a graph in a report. This control, like others, can be placed anywhere in
the report and enables a large number of variables to be viewed.
The style of the text, axes and keys (i.e., font, size, color, etc.), may also be configured. The
variable keys, axis color, background color (it can also be transparent) and the variables to be
represented may be displayed or hidden.
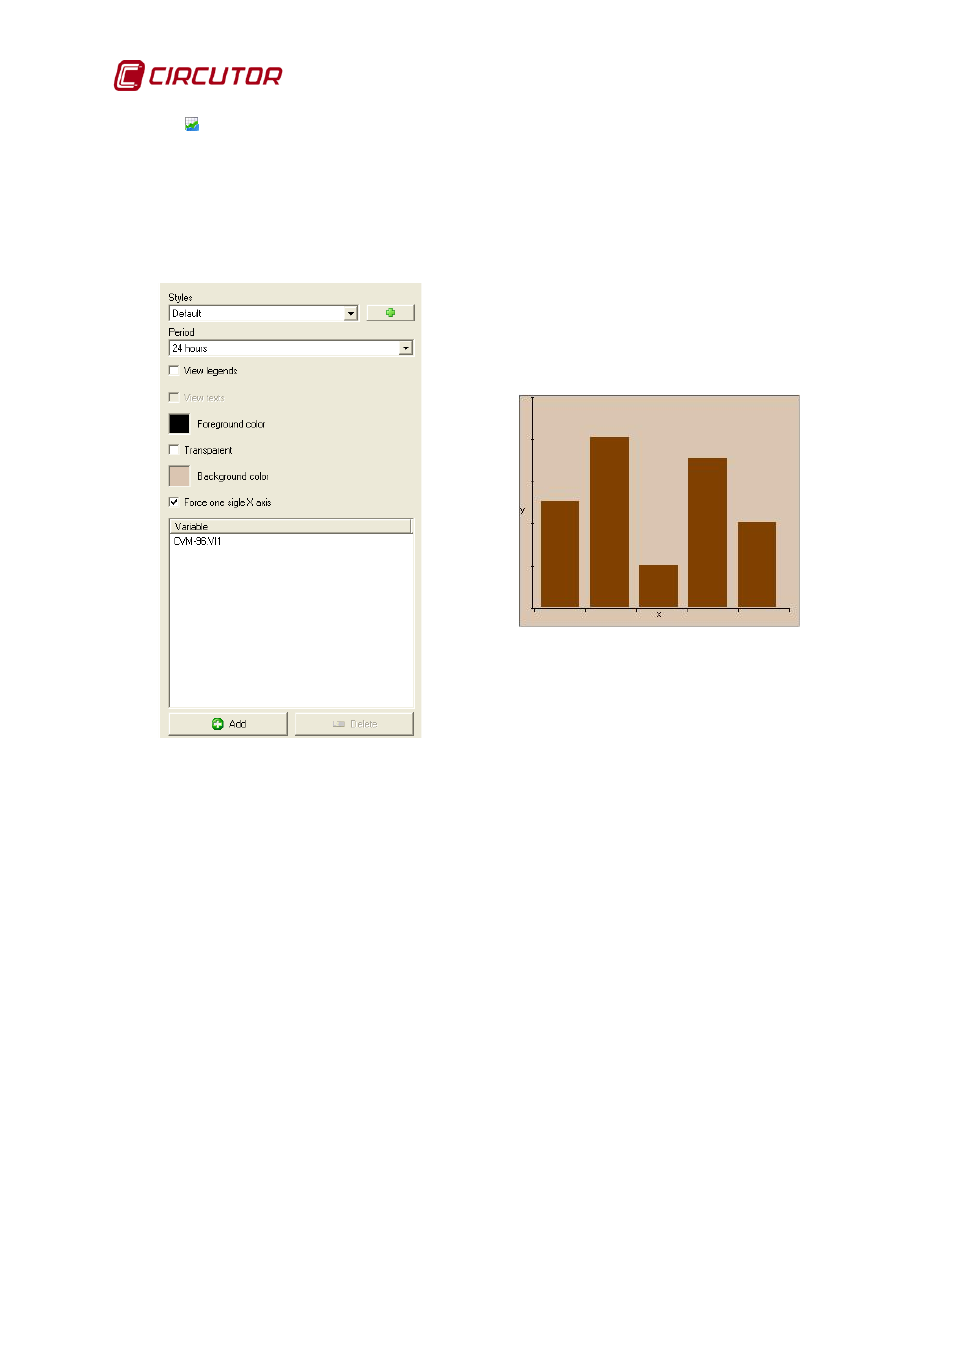
Embedded graph control properties and control representation
The color and type of representation for each variable may be chosen. The choices are bar
graph, lines, points, piechart by variable and piechart by period. For scatter type representations we
can select between dots, circles (5x5), squares (5x5), diamonds (5x5), X (5x5), Crosses (5x5), Xs
(3x3) and Crosses (3x3). Also, for the line representation, the style can be chosen (solid, dashed,
dotted, line-dot and line-dot-dot) as well as thickness (between 1 and 10 points). Equally, for the bar
graphs, lines and points we can force the mínimum and máximum of the Y axe.
The most important parameter, apart from the variables to be represented, and that will
determine the final aspect of the graph (and, most importantly, the amount and distribution of
information to show), is the period of time.
The period can be automatic, 5 minutes, 10 minutes, 15 minutes, 20 minutes, 30 minutes, 1
hour, 1 day and 1 month. In the event that the period is automatic we can choose the number of values
of the variables that make up the graph we want to see.
There is a fundamental difference between choosing the automatic period and any other
period. The automatic function groups the data according to the graph period. So, for example, if the
graph period is one week, the values of all variables to be represented will be grouped into a single
value for the graph. It is therefore necessary to indicate the number of periods to be displayed, and
these periods must always be prior to the report period. Thus, a monthly report with an embedded
graph, an automatic period and 6 values, will produce a graph with values grouped by month,
displaying the month of the report (last value) and the previous five months. If automatic is not chosen,
the values represented will be grouped according to the period specified, and only those included in the
period of the report will be included. For example, a weekly report with an embedded graph that has a
one day period, will produce a graph of the week's report with the values grouped by days (typically 7