2 report control, 3 device control, 4 graph / table control – CIRCUTOR PowerStudio Series User Manual
Page 48: Report control, Device control, Graph / table control
PowerStudio
48 User Manual
6.2.1.2
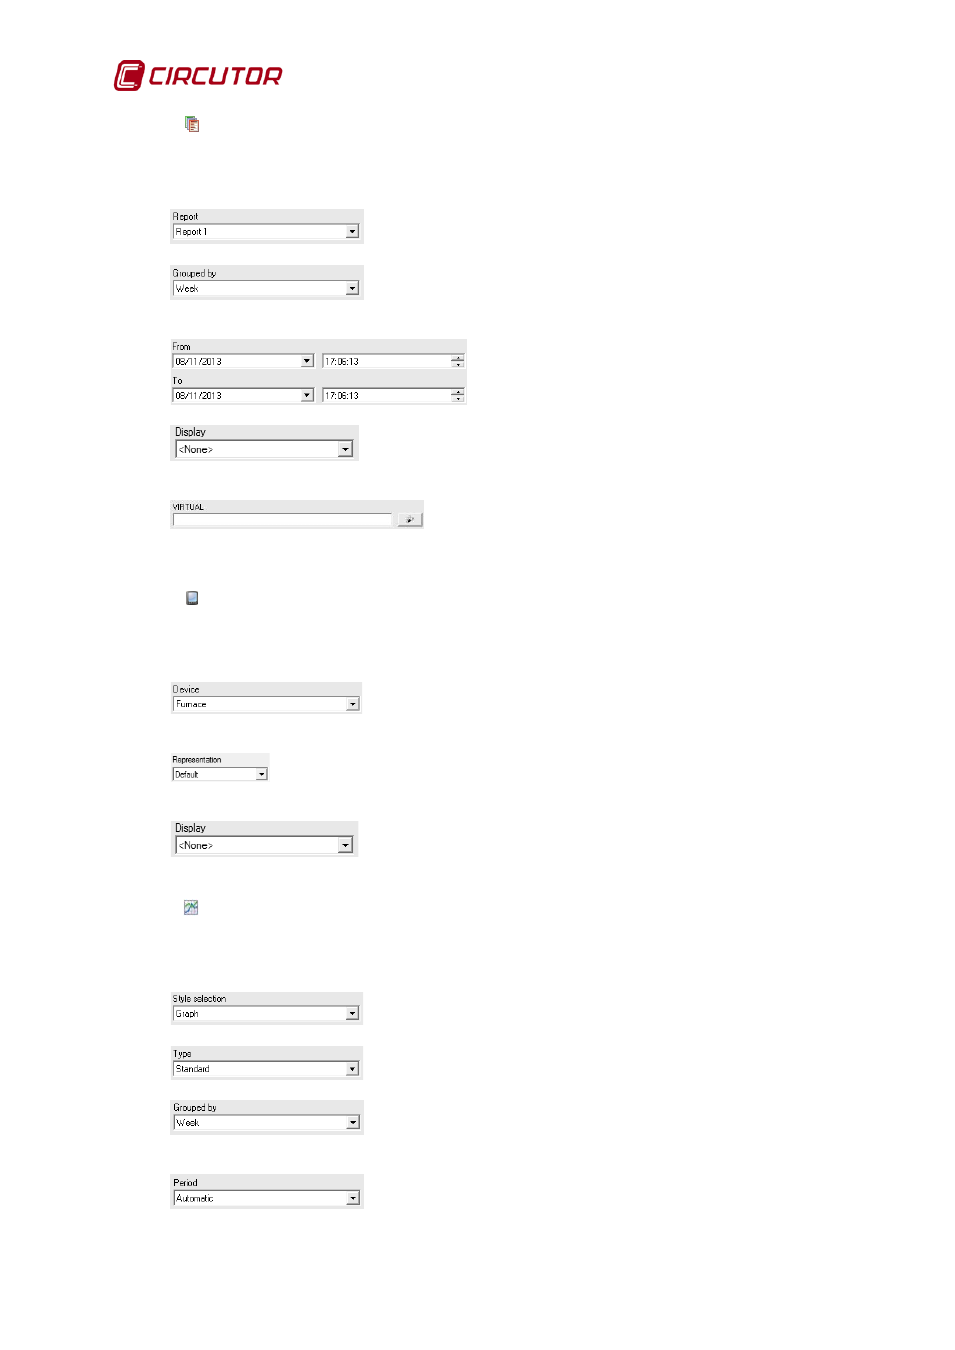
Report control
6By selecting this option, the control will become direct access to a previously defined report
(see Chapter 7). The options available are:
Select the report to be displayed from the client screen.
The group type for the data to be displayed in the report can be
chosen. If the "User Defined" option is selected, the following fields will appear
Here the report period is specified.
Here the appearance of the control on the SCADA screen is
specified. Select ‘button’, ‘image’ or ‘text’.
Here, if the selected report has virtual variables, the
device, area or event to be displayed will be chosen.
6.2.1.3
Device Control
When this option is selected, the control will become a direct access to the screens that show
the variables of a device. The options available are:
Use the drop-down menu to select the device whose variables
screen will be displayed upon clicking on the control from the client screen.
Here it will be specified whether the representation will be default, analogue or
text.
Here the appearance of the control on the SCADA screen is
specified. Select ‘button’, ‘image’ or ‘text’.
6.2.1.4
Graph / Table Control
Use this option to make a graph or a table of one or more variables from one or more devices. The
options available are:
A choice between graph and table.
Choose the desired graph or table type.
The group type for the data to be displayed in the graphs or tables
can be chosen.
In the same way the sample period can be specified for graphs or
tables.