Lync application overview, Viewing the health status of the lync application, Viewing the lync call statistics – H3C Technologies H3C Intelligent Management Center User Manual
Page 20
11
Lync application overview
This area displays the Lync application health status and Lync call statistics.
Viewing the health status of the Lync application
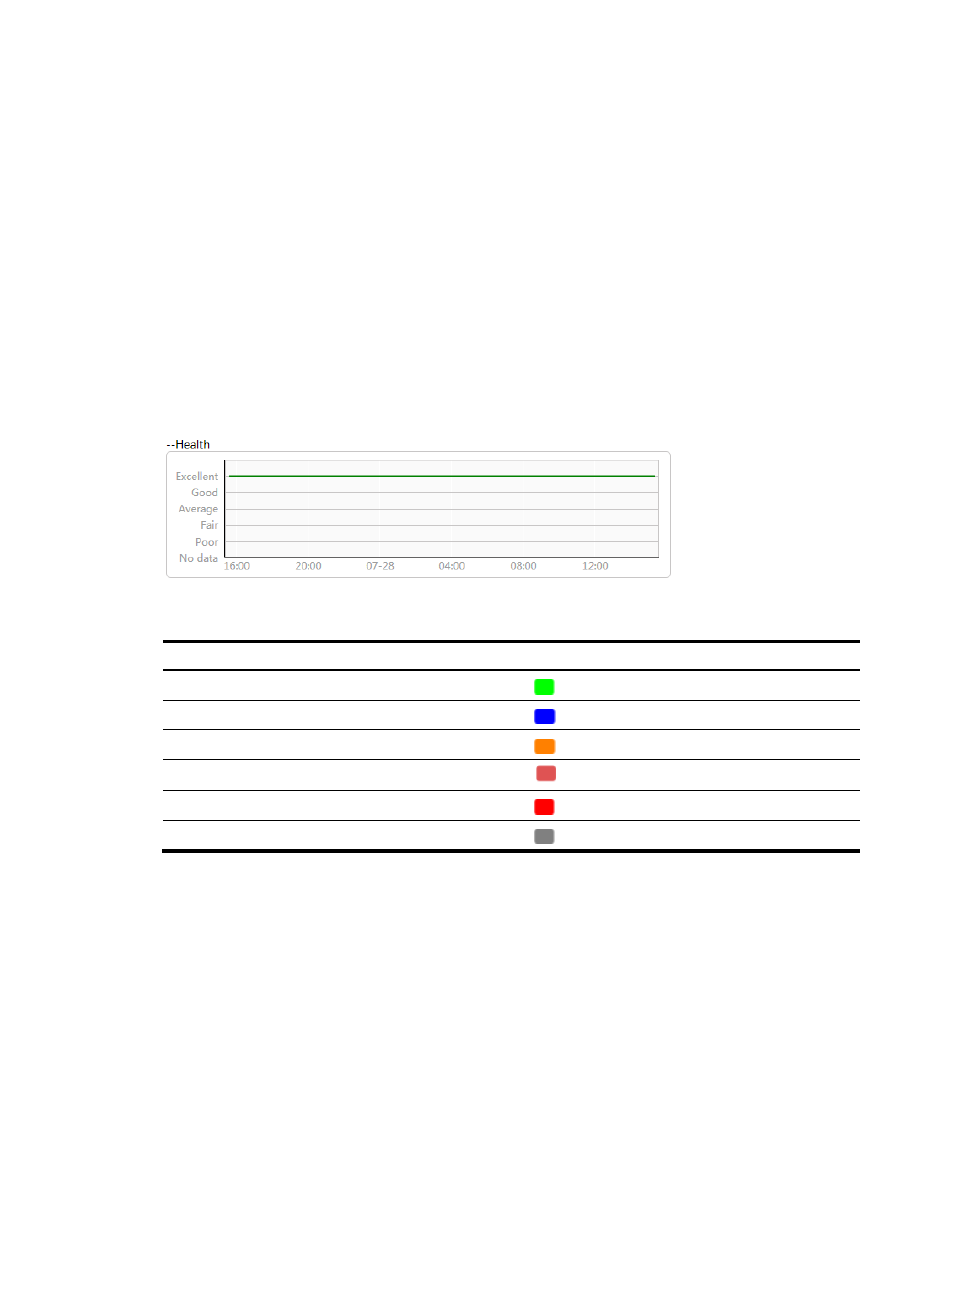
Click Lync Application Overview to display the health status changes of the Lync application over the
specified time range in a line chart:
•
The horizontal axis represents different time points.
•
The vertical axis represents the health status of the Lync application.
•
The health status values are color coded. For more information, see
Move the pointer over a spot on the curve to display the health status of the Lync application at the
specific time point.
Figure 8 Lync Application Overview line chart
Table 7 Health status values and colors
Health status
Font color
Excellent
Green
Good
Blue
Average
Orange
Fair
Dark red
Poor
Red
No data
Gray
Viewing the Lync call statistics
Click Lync Calls to display the number of calls per category over the specified time range in a line chart:
•
The horizontal axis represents different time points.
•
The vertical axis represents the number of calls.
•
The call categories are color coded. For more information, see
.
Move the pointer over a spot on the curve to display the call statistics (including the number of calls per
category and their percentages) at the specific time point.