Viewing the health status of a device, Viewing the cpu usage of a device – H3C Technologies H3C Intelligent Management Center User Manual
Page 25
16
Health status
Font color
No data
Gray
Viewing the health status of a device
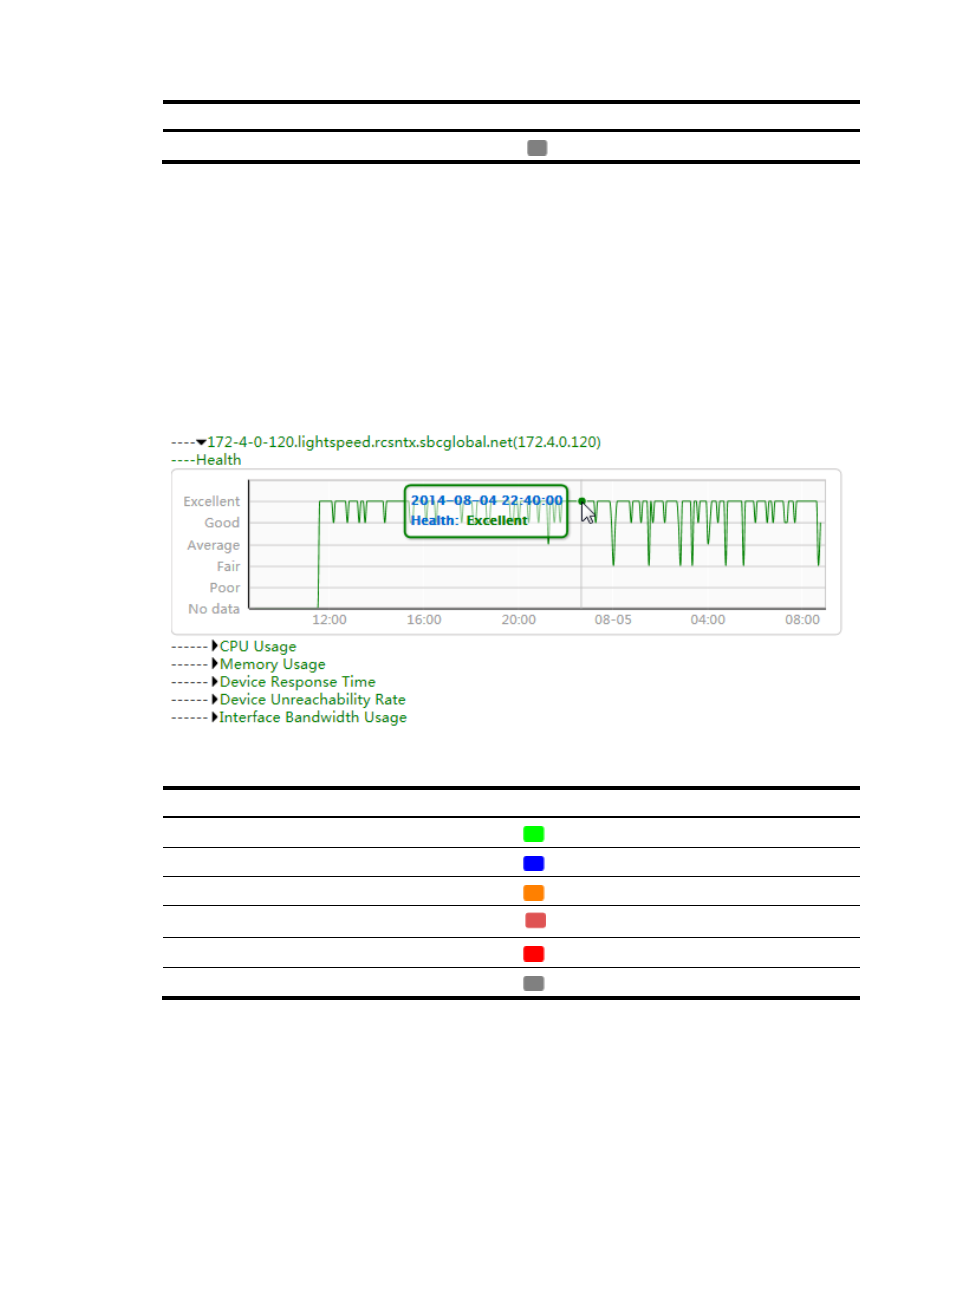
Click the name of a network device to view its health status changes over the specified time range in a
line chart:
•
The horizontal axis represents different time points.
•
The vertical axis represents the health status of the device.
•
The health status values are color coded. For more information, see
.
Move the pointer over a spot on the curve to display the health status of the device at the specific time
point.
Figure 16 Network device health status line chart
Table 12 Health status values and colors
Health status
Font color
Excellent
Green
Good
Blue
Average
Orange
Fair
Dark red
Poor
Red
No data
Gray
Viewing the CPU usage of a device
Click CPU Usage for a network device to display its CPU usage over the specified time range in a line
chart.
For more information, see "