Lync server overview, Table 8 – H3C Technologies H3C Intelligent Management Center User Manual
Page 21
12
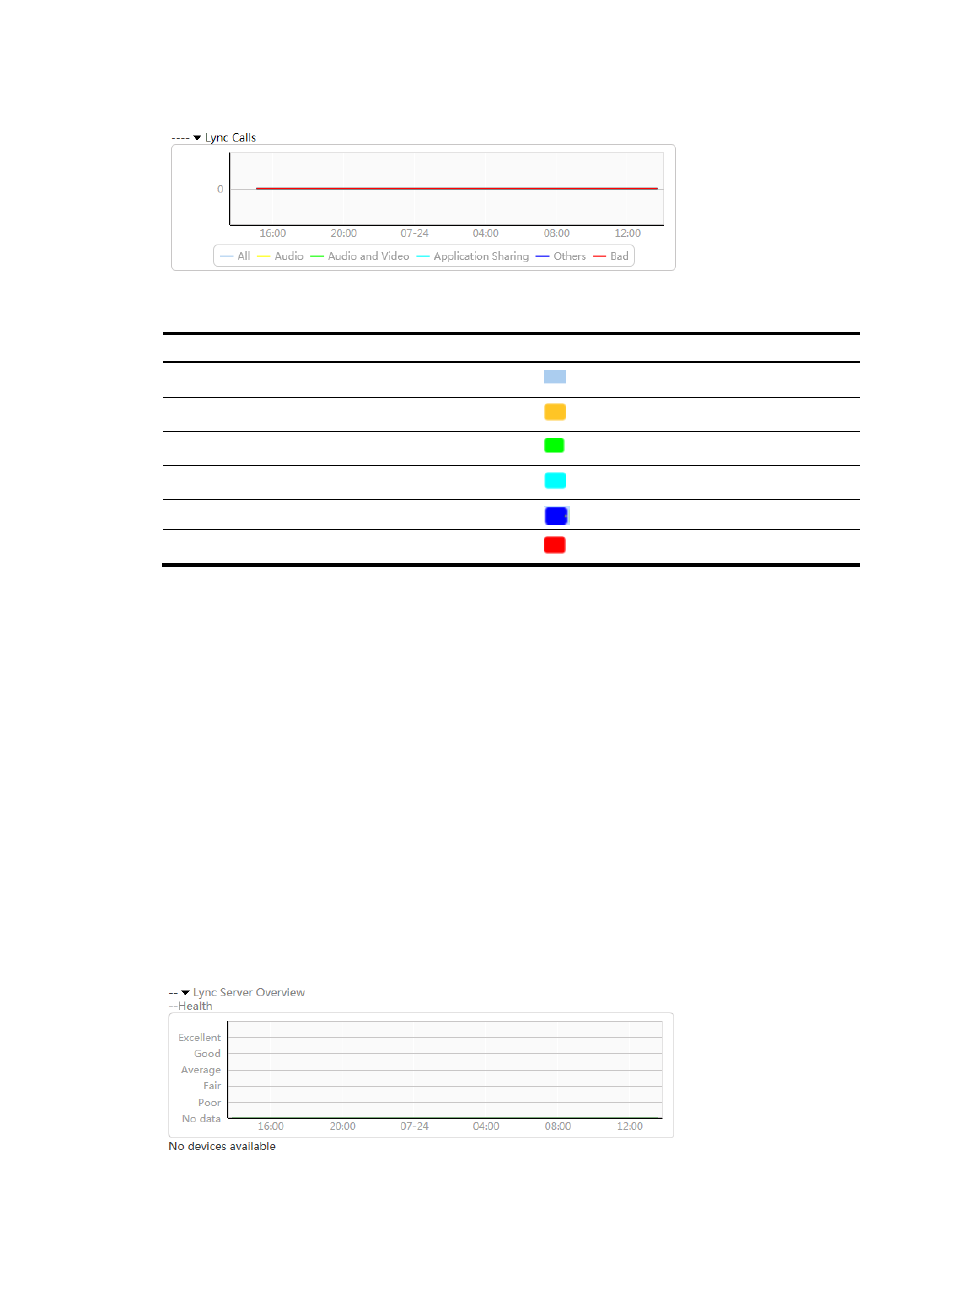
Figure 9 Lync Calls line chart
Table 8 Call categories and colors
Call category Color
All
Light blue
Audio
Dark yellow
Audio and Video
Green
Application Sharing
Cyan
Others
Blue
Low Quality
Red
Lync server overview
This area displays the health status and hardware usage of monitored Lync servers.
Viewing the overall health status of all monitored Lync servers
Click Lync Server Overview to display the overall health status changes of all monitored Lync servers over
the specified time range in a line chart.
The overall health status of all monitored Lync servers is determined by the Lync server in the worst health
state. When UCHM obtains no data, the line chart displays No data.
•
The horizontal axis represents different time points.
•
The vertical axis represents the health status of the Lync servers.
•
The health status values are color coded. For more information, see
Table 12
.
Move the pointer over a spot on the curve to display the health status of the Lync servers at the specific
time point.
Figure 10 Lync Server Overview line chart