Viewing the memory usage of a lync server, Viewing the device response time of a lync server – H3C Technologies H3C Intelligent Management Center User Manual
Page 23
14
•
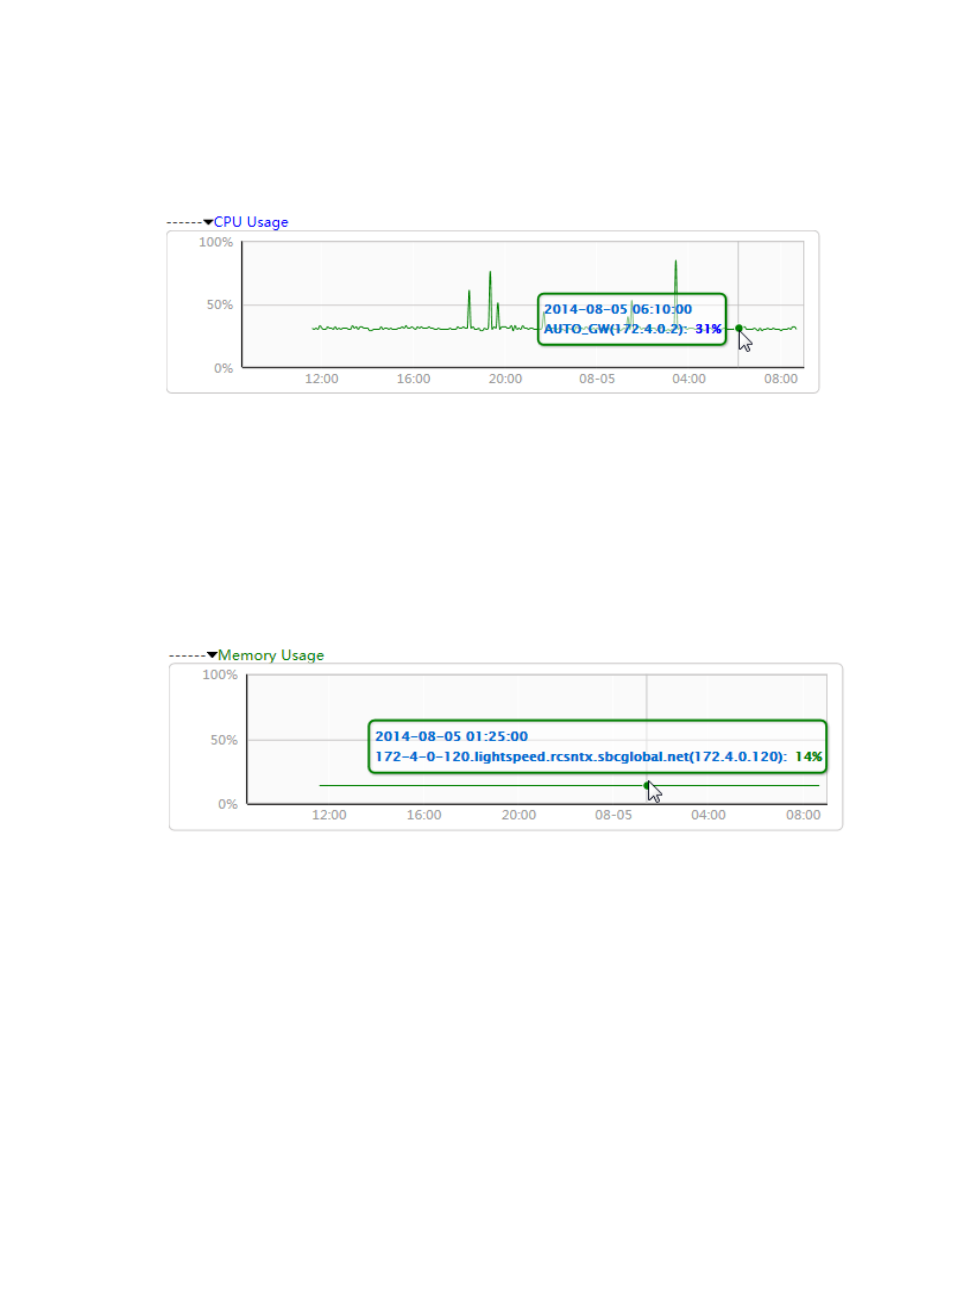
The vertical axis represents the CPU usage value.
Move the pointer over a spot on the curve to display the CPU usage value of the server at the specific time
point.
Figure 12 CPU Usage line chart
Viewing the memory usage of a Lync server
Click Memory Usage for a Lync server to display its memory usage over the specified time range in a line
chart:
•
The horizontal axis represents different time points.
•
The vertical axis represents the memory usage value.
Move the pointer over a spot on the curve to display the memory usage value of the server at the specific
time point.
Figure 13 Memory Usage line chart
Viewing the device response time of a Lync server
Click Device Response Time for a Lync server to display its response time changes over the specified time
range in a line chart:
•
The horizontal axis represents different time points.
•
The vertical axis represents the response time in milliseconds.
Move the pointer over a spot on the curve to display the response time of the Lync server at the specific
time point.