Network overview – H3C Technologies H3C Intelligent Management Center User Manual
Page 24
15
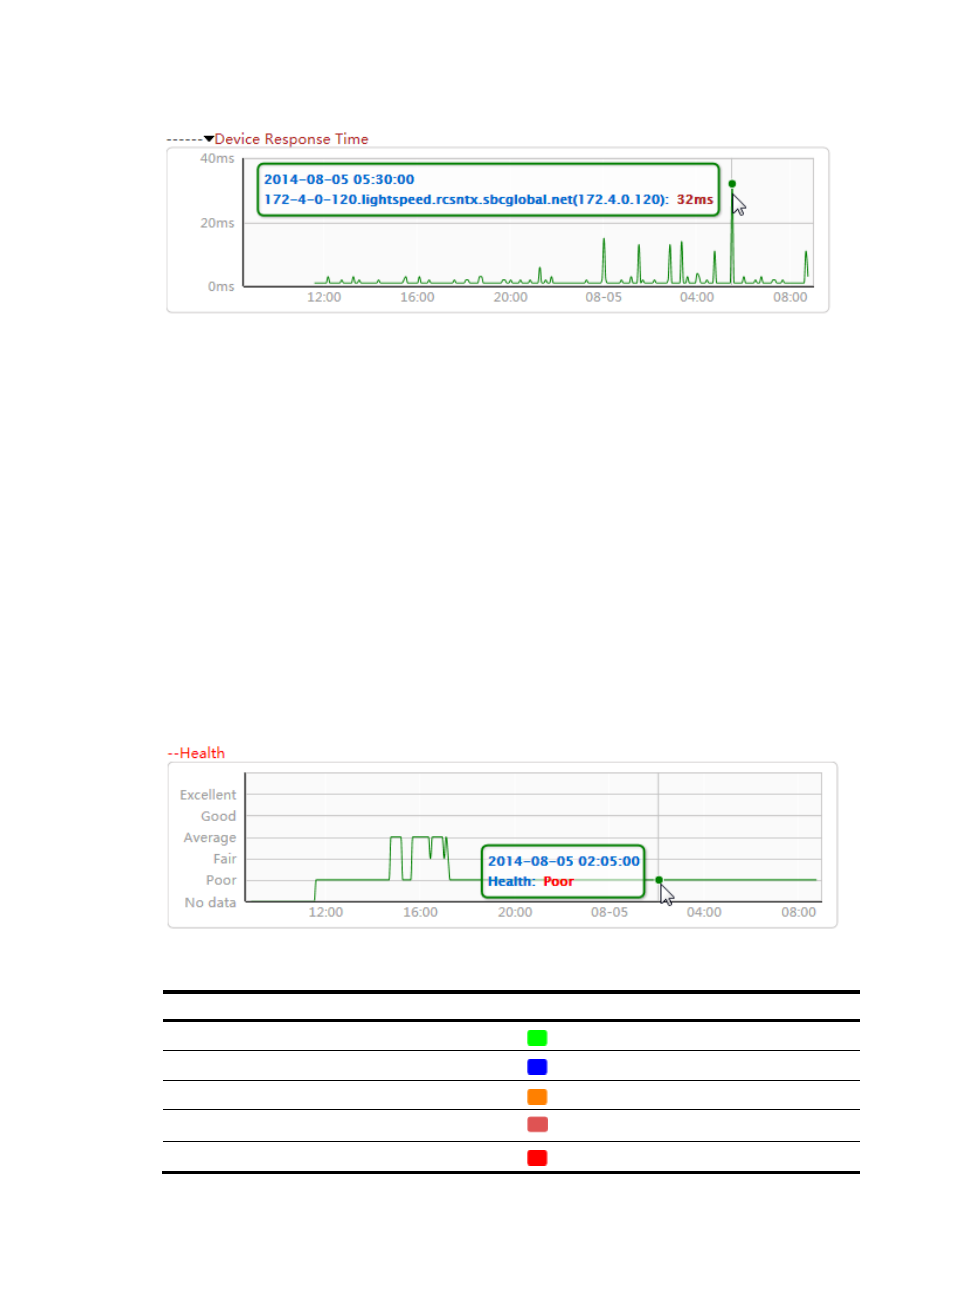
Figure 14 Device Response Time line chart
Network overview
This area displays the health status and hardware usage of monitored network devices.
Viewing overall health status of all monitored devices
Click Network Overview to display the overall health status changes of all monitored network devices
over the specified time range in a line chart.
The overall health status of all monitored network devices is determined by the device in the worst health
state:
•
The horizontal axis represents different time points.
•
The vertical axis represents the health status of the network devices.
•
The health status values are color coded. For more information, see
Move the pointer over a spot on the curve to display the overall health status of monitored network
devices at the specific time point.
Figure 15 Network device health status line chart
Table 11 Health status values and colors
Health status
Font color
Excellent
Green
Good
Blue
Average
Orange
Fair
Dark red
Poor
Red