Dlci table screen, Dlci table screen -36 – Verilink T1 Access Router (34-00327) Product Manual User Manual
Page 144
4-36
T 1 A c c e s s R o u t e r
Figure 4.29
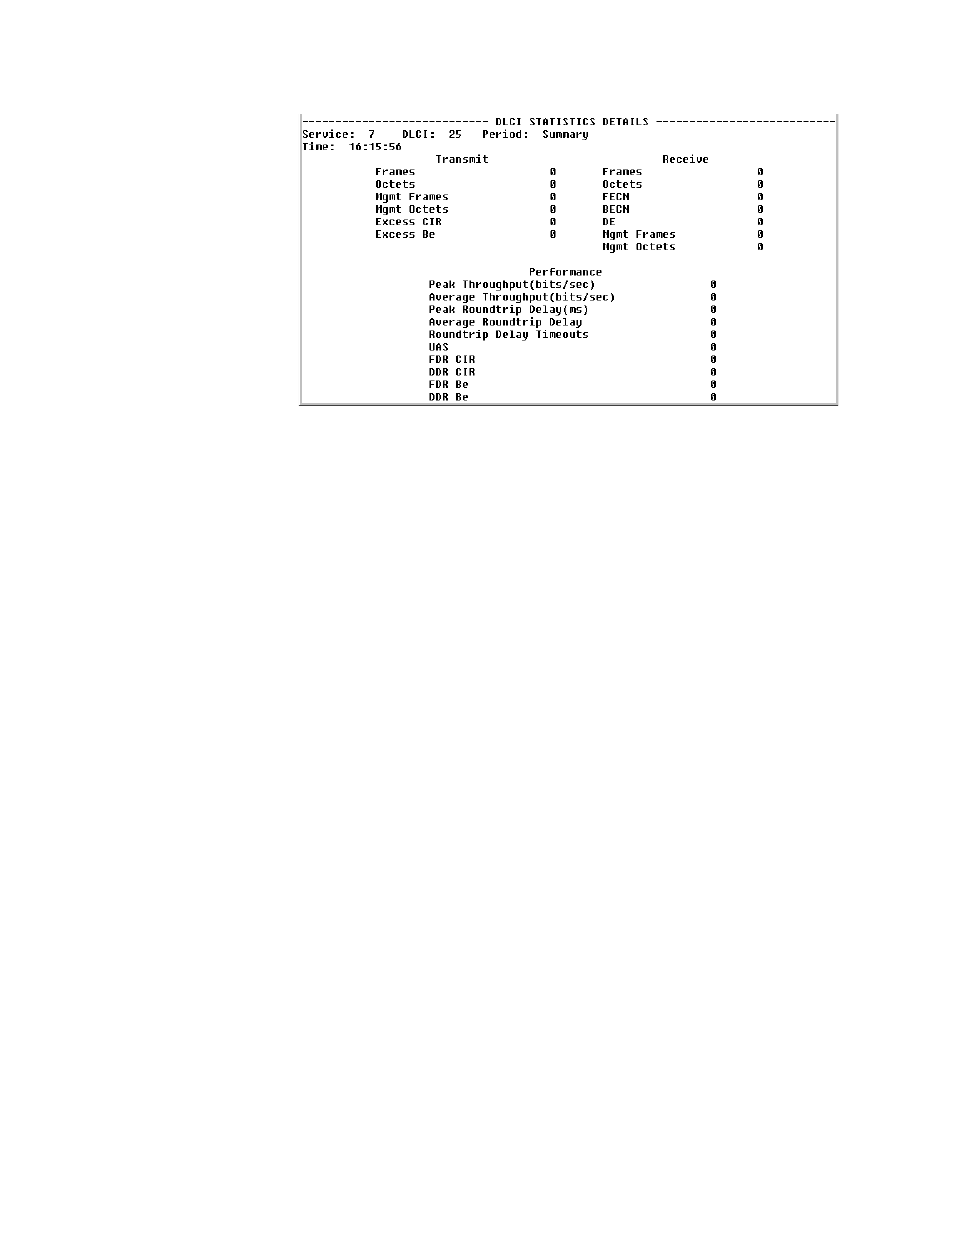
DLCI Statistics Details Screen
The DLCI Statistics screen in the preceding figure shows a summary that
includes all 96 buckets. You can choose to see the statistics for any given
bucket by selecting a specific interval under the <Period> column on the
DLCI Statistics screen. The MIB (ipadv2.mib) describes each available
statistic. “FDR” on the screen above refers to Frame Delivery Ratio, which is
the ration of successful frame receptions to attempted frame transmissions.
“DDR” refers to Data Delivery Ratio or the ratio of successful payload bytes
received to attempted payload bytes transmitted. “DE,” or Discard Eligible,
refers to the data that is first eligible to be discarded when network congestion
occurs.
DLCI Table Screen
You can access the DLCI Table screen from the Frame Relay Service Details
Screen shown on page 4-17. The DLCI Table screen displays a table of all
DLCIs on a specific frame relay service along with their state and alarm
conditions.