Diagnostics, Diagnostics -43 – Verilink T1 Access Router (34-00327) Product Manual User Manual
Page 71
W e b S e r v e r I n t e r f a c e
3-43
Diagnostics
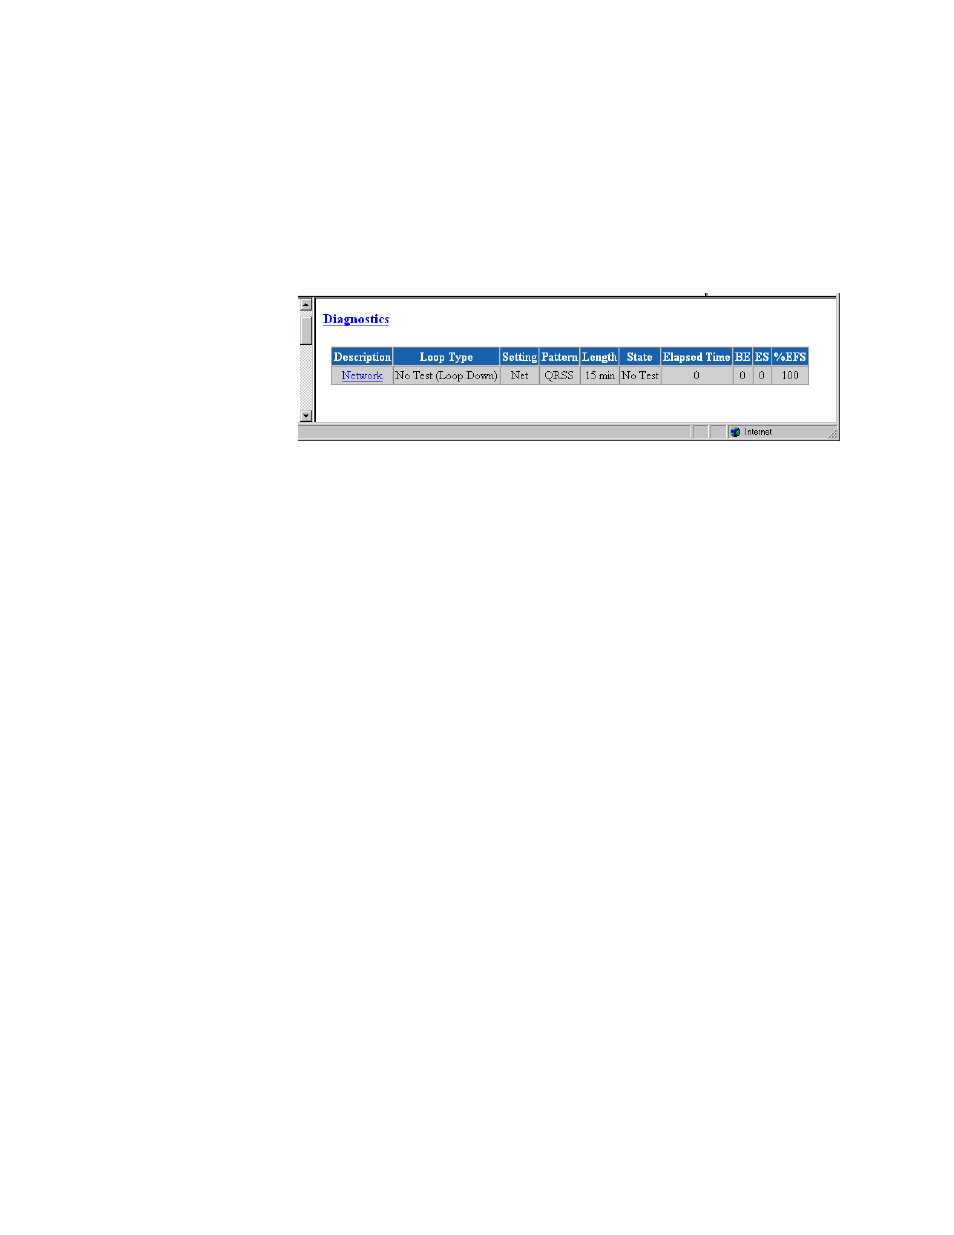
The Diagnostics screen (Figure 3.34) provides a table for viewing the current
settings for the test and maintenance functions performed on the available
interfaces. This screen shows an upper-level view of all the interfaces so you
can see if any port is under test, and, if so, view the results. You may change
Diagnostic parameters on the Test Details screen, which is accessed from a
button on the Diagnostics screen. The properties of the Diagnostics table are
described in the paragraphs below.
Figure 3.34
Diagnostics Screen
Description
Describes the type of interface selected for testing.
Loop Type
Describes the type of loop test (if any) performed on the selected interface.
Setting
Displays the bandwidth on which you wish to perform the BERT.
Pattern
Specifies the pattern to be transmitted during a BERT for the selected port.
Length
Displays the length of time for which the BERT should run for the selected
interface.
State
Displays the current BERT state for the selected interface.
Elapsed Time
Displays the time elapsed since a BERT began or, if completed, the total test
time.
BE
Displays the total number of bit errors detected since the BERT began or
since error statistics were last cleared.
ES
Displays the number of asynchronous errored seconds detected since the
BERT began or since error statistics were last cleared. This parameter
includes bit error seconds and sync loss seconds.
% EFS
Displays what percent of the total BERT time ran error free. This ratio is
derived from the number of error-free seconds divided by the number of
seconds accumulated in Elapsed Time.