Wavetronix SmartSensor 105 (SS-105) - User Guide User Manual
Page 72
CHAPTER 6 • LANE SETUP
71
cancel your changes, click Cancel and Refresh. Clicking Refresh button will restore
the current interval length.
2 Synchronize the sensor time to your computer’s UTC time. This will ensure that inter-
vals will begin and end at the expected time. Intervals are timestamped at the end of
the interval. To synchronize the sensor time, click the Synchronize icon, which shows
two overlapping clocks.
The other two icons near the bottom of the page are for logging data:
˽
Turn Interval Data Logging On/Off – Turns event logging on and off. Click on the icon
(it shows a clock and light switch) to toggle the switch on and off. Once you’ve turned
it on, you will be prompted to create a new log file if there is not already an existing
one. Now all of the data shown on the screen will be written to a standard text file that
can be viewed at any time.
˽
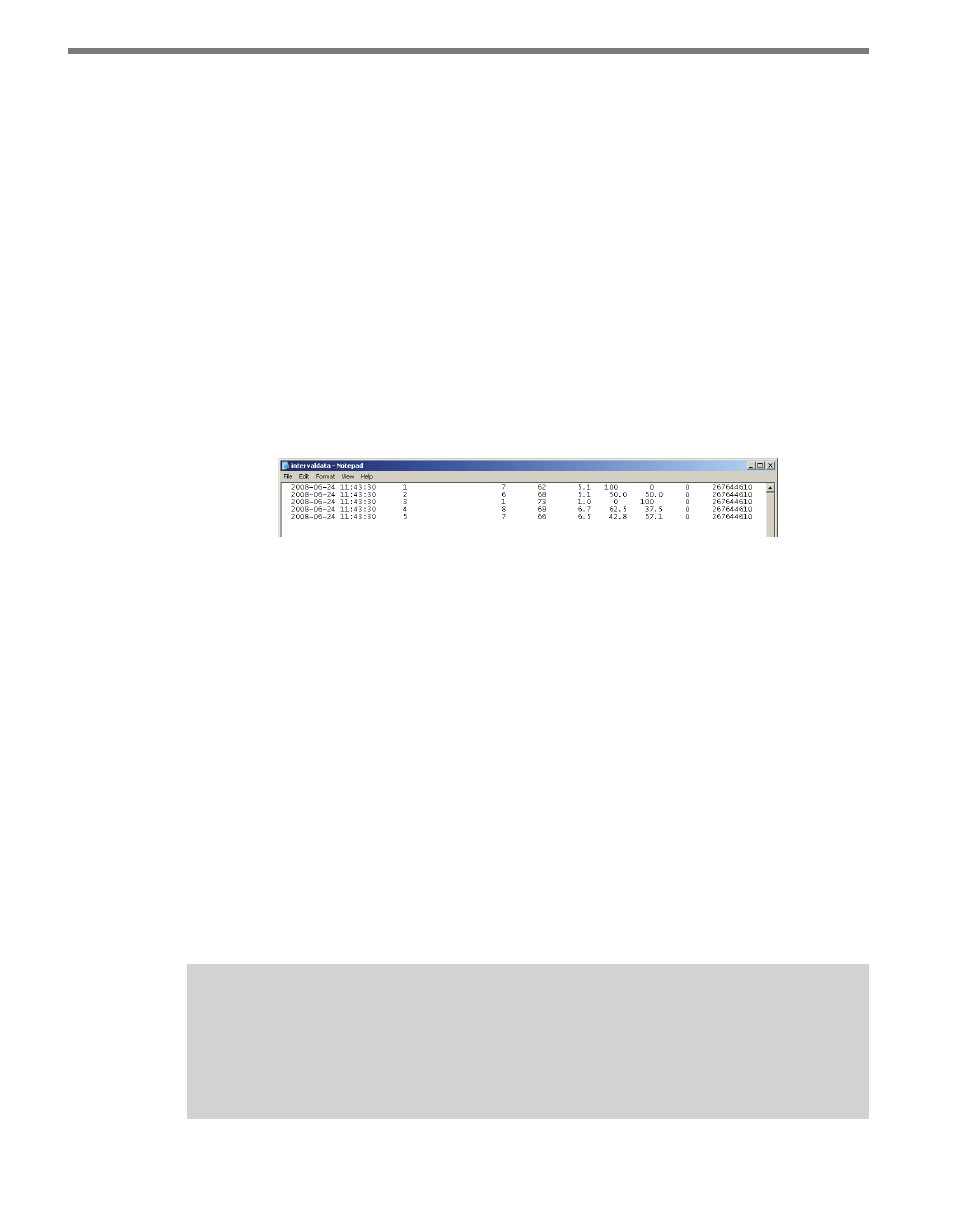
View Interval Data Log – Opens the log file in a text editor such as Notepad (see Fig-
ure 6.12). The icon shows a clock and paper.
Figure 6.12 – Interval Data Log
The interval data in the Interval Data Screen is displayed in a table that contains the lane
name, volume, speed, occupancy, and class. The lane at the top of the table is the lane closest to
the sensor. At the bottom of the screen is a status bar that indicates the time the interval data
table was last updated. It also displays the amount of time that has elapsed since this update.
˽
Lane Name – Displays the string of eight alphanumeric characters that describes the
lane.
˽
Volume – Shows the number of events during the interval.
˽
Interval Lane Speed – Represents the average speed of the lane during the time of the
interval. The speed is displayed either in miles per hour (mph) or kilometers per hour
(kph), depending on your settings.
˽
Occupancy – Displays the percentage of time vehicles occupied the sensor’s detection
zone during the selected interval.
˽
Class – Represents the percentage of vehicles detected as fitting in one of three length-
based classification groupings (Small, Medium, and Large).
Note
To open data logs from anywhere in the SmartSensor Manager program, go to
File
> Data Logs . . . > Open and select the type of log. This will open the most recently
used log.