H3C Technologies H3C Intelligent Management Center User Manual
Page 17
7
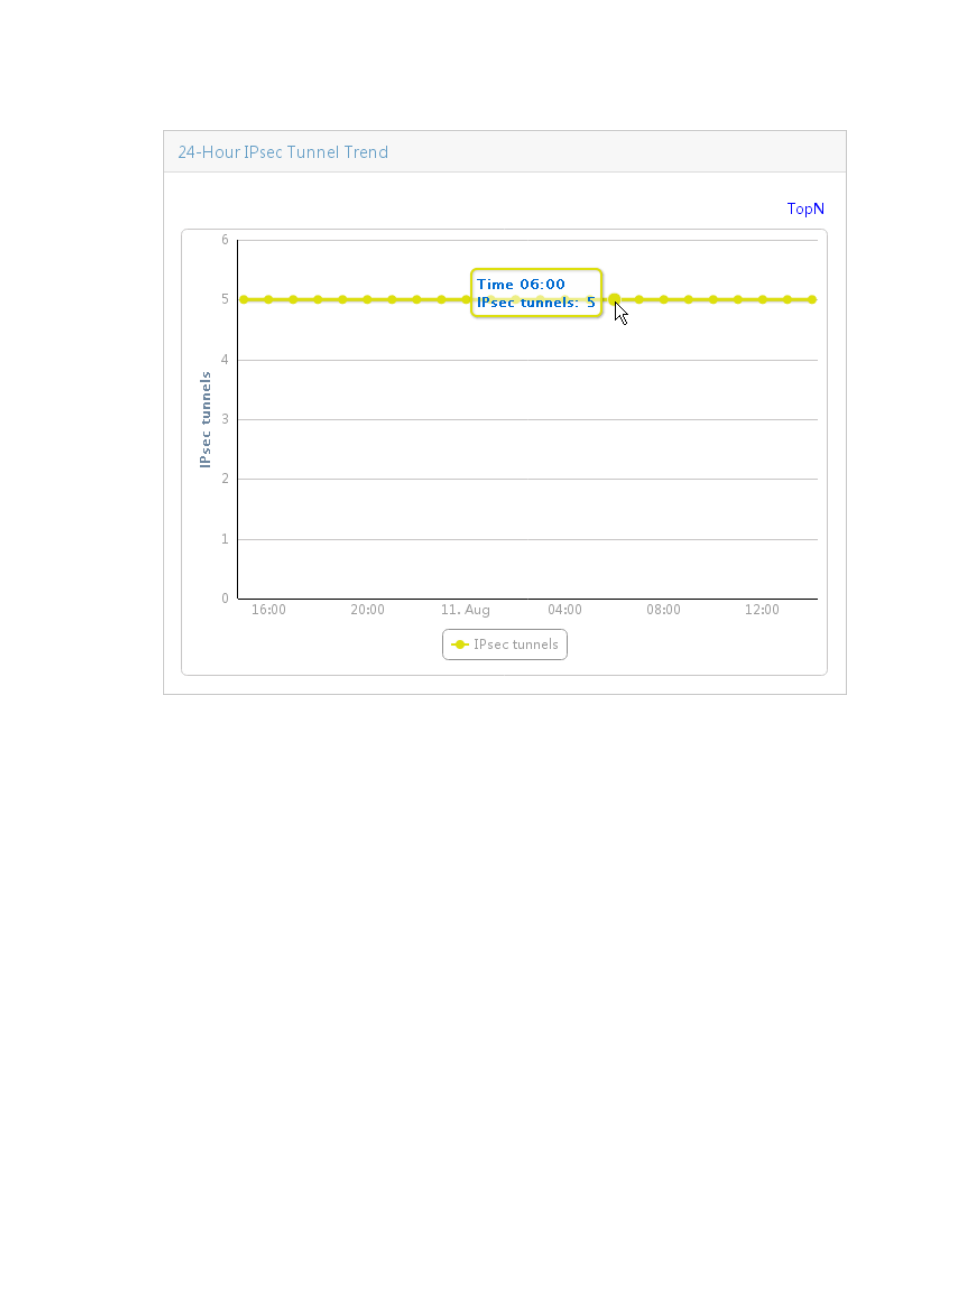
Figure 6 24-Hour IPsec Tunnel Trend
Click TopN on the top right corner of the graph to view more IPsec tunnel statistics, including the following
lists:
•
Top 5 Devices by Average Active IPsec Tunnels—Displays the top 5 devices with the highest
average number of active IPsec tunnels in the last 24 hours.
•
Top 5 Devices by Average Active IPsec SAs—Displays the top 5 IPsec devices with the highest
average number of IPsec SAs in the last 24 hours.
•
Top 5 Devices by Total Receive Rate (pps) of IPsec Tunnels—Displays the top 5 devices with the
highest average IPsec tunnel receive rate in the last 24 hours.
•
Top 5 Devices by Total Transmit Rate (pps) of IPsec Tunnels—Displays the top 5 devices with the
highest average IPsec tunnel transmit rates in the last 24 hours.
•
Top 5 Devices by Total Inbound Drop Rate (%) of IPsec Tunnels—Displays the top 5 devices with the
highest packet drop rate in the inbound direction of all IPsec tunnels in the last 24 hours.
•
Top 5 Devices by Total Outbound Drop Rate (%) of IPsec Tunnels—Displays the top 5 devices with
the highest packet drop rate in the outbound direction of all IPsec tunnels in the last 24 hours.
•
Top 5 Devices by Average Active IKE Tunnels—Displays the top 5 devices with the highest average
number of active IKE tunnels in the last 24 hours.
All these statistical lists are basically the same.
shows an example list. Click the device name to
view the device details.