Vpn domain traffic trend graph – H3C Technologies H3C Intelligent Management Center User Manual
Page 18
Advertising
8
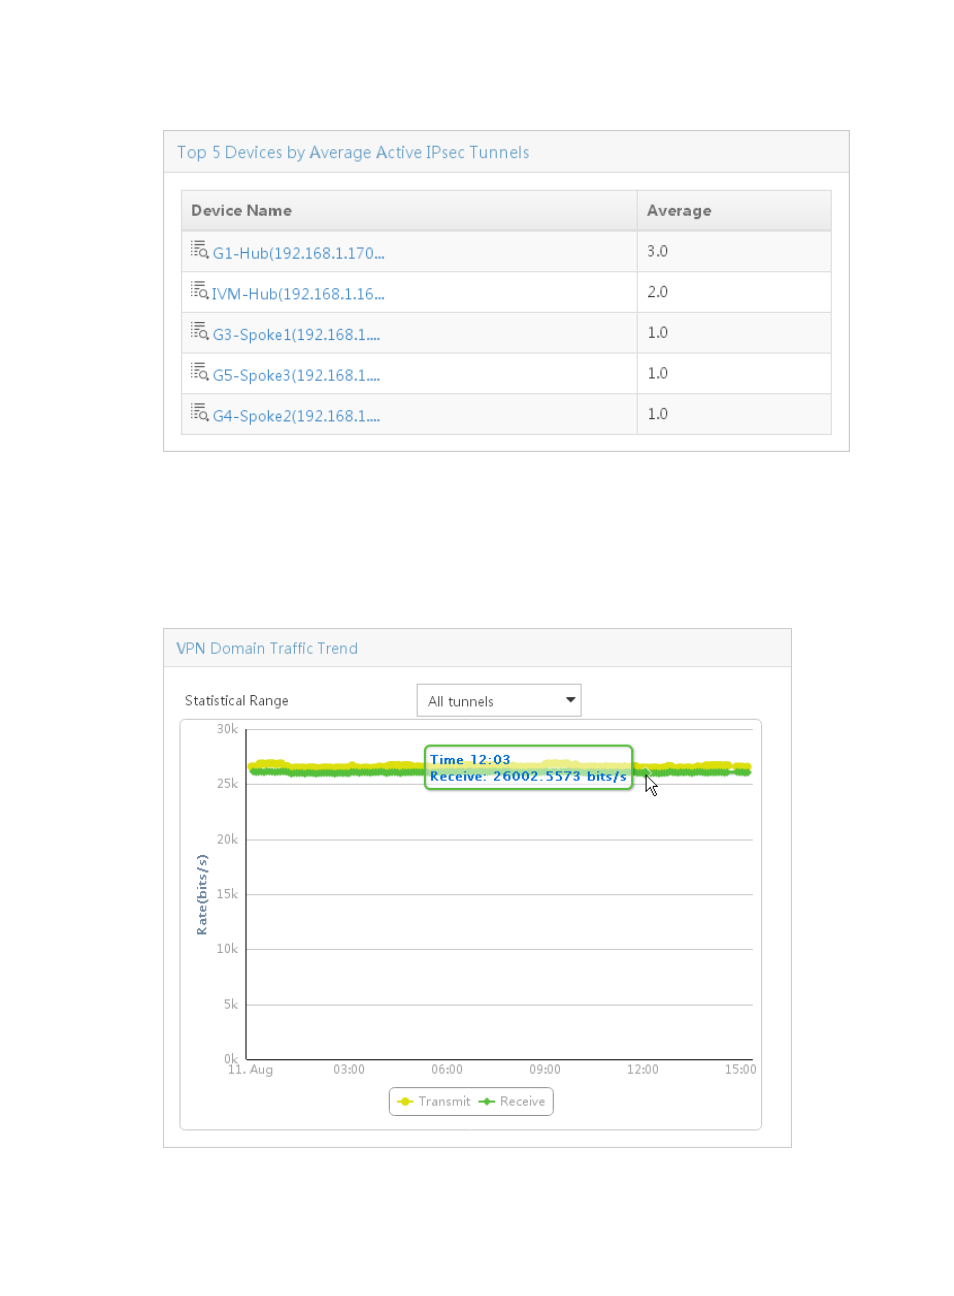
Figure 7 Top 5 Devices by Average Active IPsec Tunnels
VPN Domain Traffic Trend graph
As shown in
, the graph shows the transmit and receive rates of all IPsec tunnels in a specified
VPN domain or in all VPN domains in a line chart. The yellow line represents the transmit rate, and the
green line represents the receive rate.
Figure 8 VPN Domain Traffic Trend
Advertising