HEIDENHAIN PWM 20 User Manual
Page 169
Advertising
172
HEIDENHAIN ATS Software User's Manual
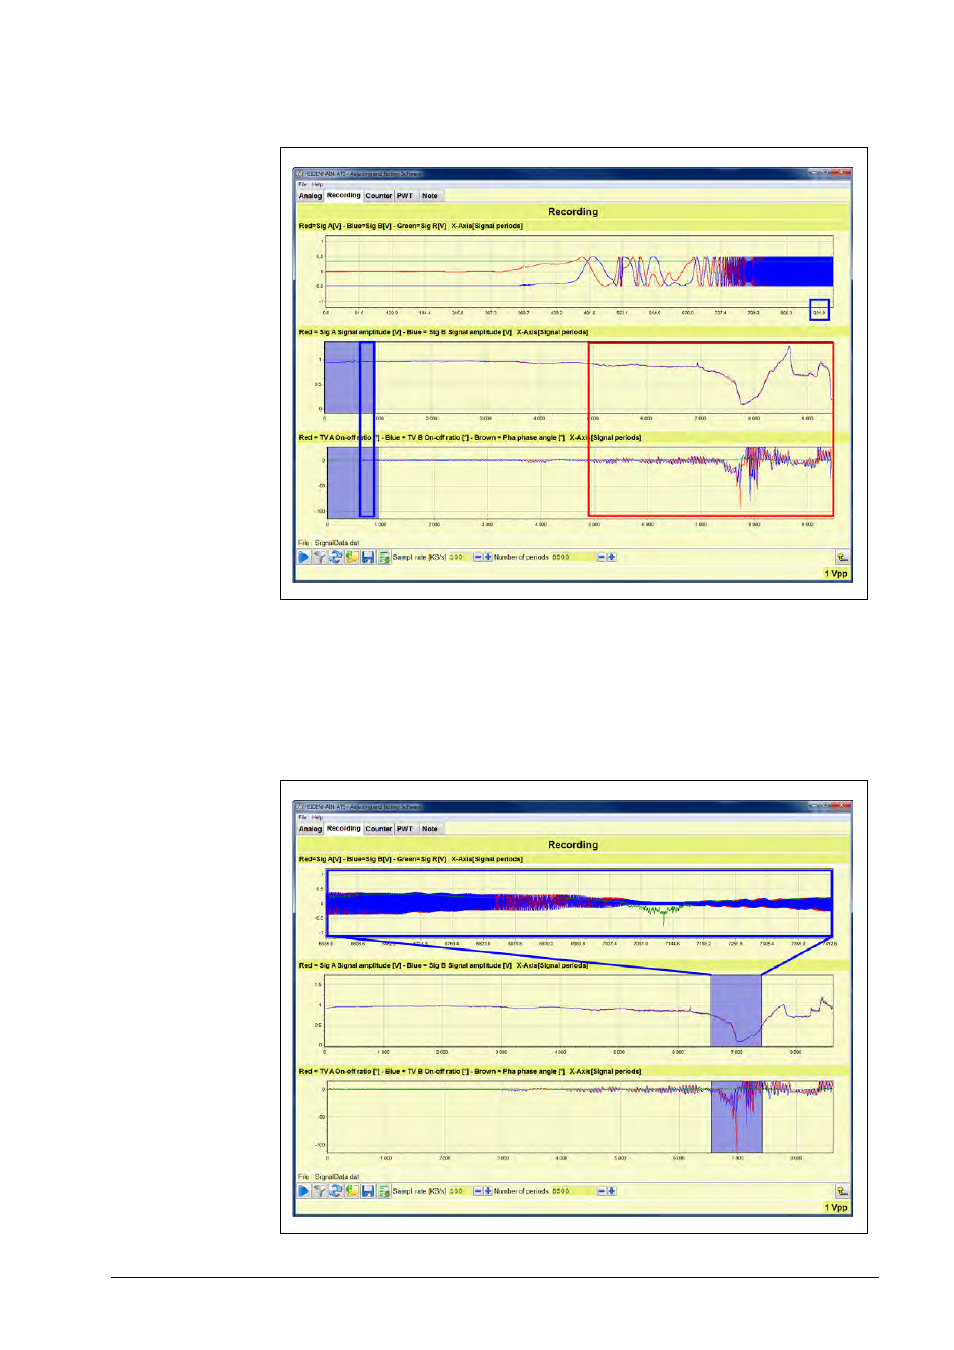
The image below shows the record of a linear encoder with heavy contamination.
Area in the red square:
Signal drop and extreme on-off ratio and phase shift errors at the end of the measuring range.
The blue rectangles show that the upper diagram only contains a section of the signal train.
In the lower diagrams, this section is at the beginning of the measurement (about 1000 periods
out of 8500).
By means of the blue areas you can also display the right side of the diagram in detail (the zoom
function can be used in addition).
Advertising