HEIDENHAIN PWM 20 User Manual
Page 180
November 2014
Checking incremental encoders
183
Description of the PWT screen
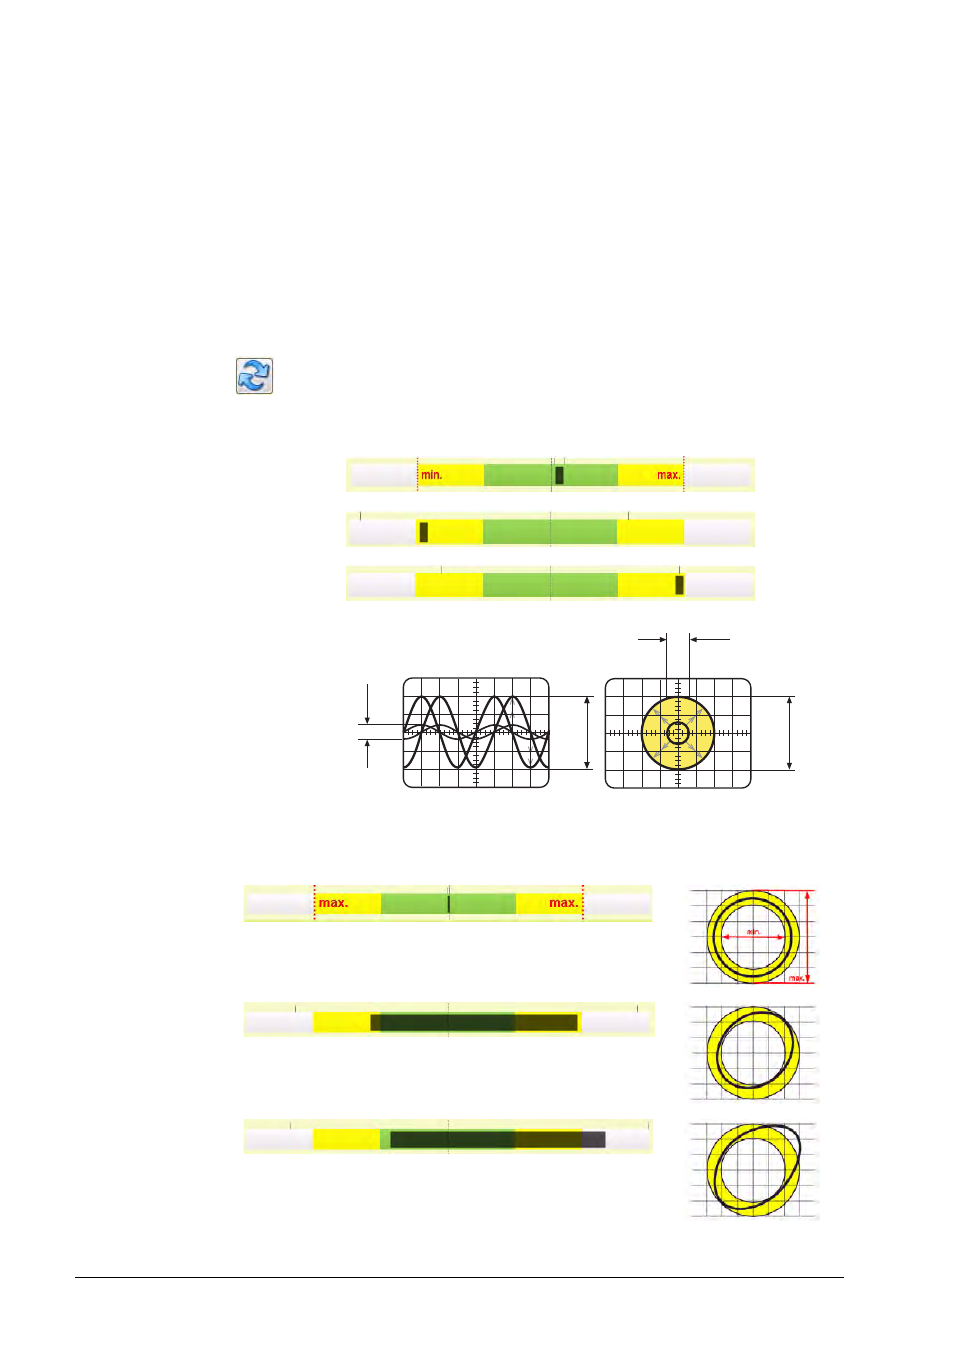
Display 1: Amplitude of analog signal
The position of the bar represents the signal amplitude (left = small signal, right = large signal).
Display 2: Signal deviation
The bar changes in width (narrow = optimum signal).
Display 3: RI position
Deviation of the reference signal from the analog signal
Display 4: RI-zero-crossing (zero crossover)
Two bars mark the positions of the RM signal edges at zero crossover (= width of the
reference signal).
Deviations of the bar positions are saved and made visible through drag indicators (lines) above
the bars (see figure).
8
The indicators can be reset with this button.
Signal amplitude:
Signal deviation:
The bar width changes in this case!
Optimum
Minimum
Maximum
Oscilloscope
display
Ideal signal quality; the bar is narrow and in the center.
Signal quality close to the tolerance limit
Bad signal quality; the bar is wider than the yellow range.
max.max.
min.
min.
max.