Netvue applications, 2 correlation, 3 protocols & templates – Comtech EF Data NetVue Release 1.1 User Guide User Manual
Page 71: 4 reports & dashboards
Operations
Revision 3
NetVue User Guide
MN-NETVUE
2–38
2.3.4
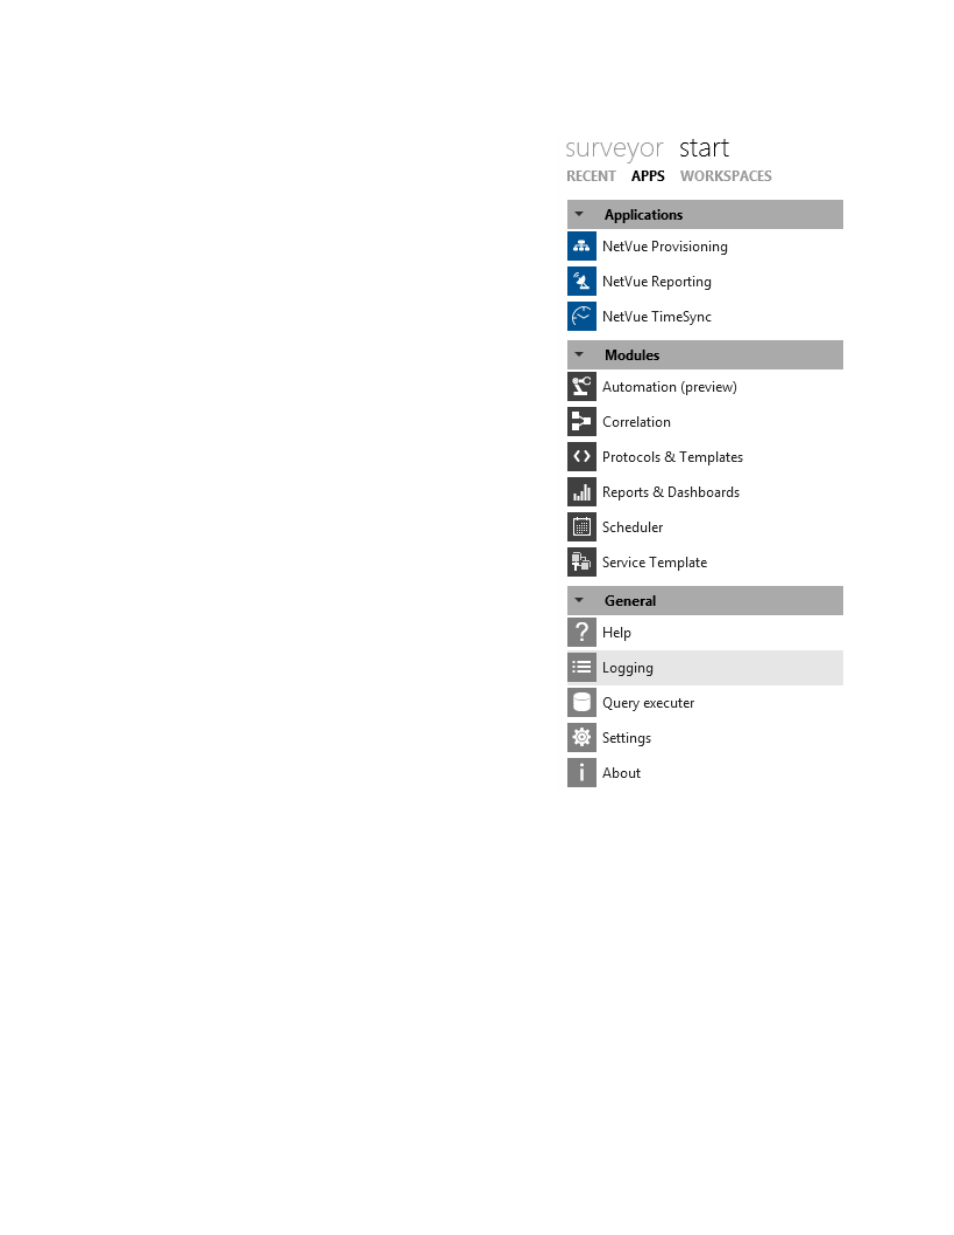
NetVue Applications
2.3.4.1 Modules: Extensions of NetVue
2.3.4.1.1 Automation
Not supported in current release.
2.3.4.1.2 Correlation
Not supported in current release.
2.3.4.1.3 Protocols & Templates
This is the interface to manage protocols for supported
Devices in NetVue. Create, maintain and adjust Alarms
and Trending Templates (see Chapter 4, Protocols in
NetVue).
2.3.4.1.4 Reports & Dashboards
Manage the NetVue Reporting tool here. Collect Reports
and create Dashboards. Dashboards are a collection of
Reports organized on the same virtual page to be
included/exported as part of the same view/document.
NetVue gives authorized users Dashboards for access to
both real-time and historical NetVue System information.
These customizable Dashboards combine critical
information and key performance indicators (KPI) from many sources. Data sources include devices,
locations, services and SLAs available in the operational environment.
Dashboards give authorized users a detailed view of operations. The intuitive Dashboard web interface is
available directly through a web browser, or from within other NetVue applications. In NetVue
applications, the information feeds into the selected Dashboard layout automatically.