6 history, 7 statistics, Statistics display – KACO Powador XP100-HV User Manual
Page 31: Daily statistics
Operating Instructions Powador XP100-HV
Page 31
I n s t a l l a t i o n / S t a r t - u p
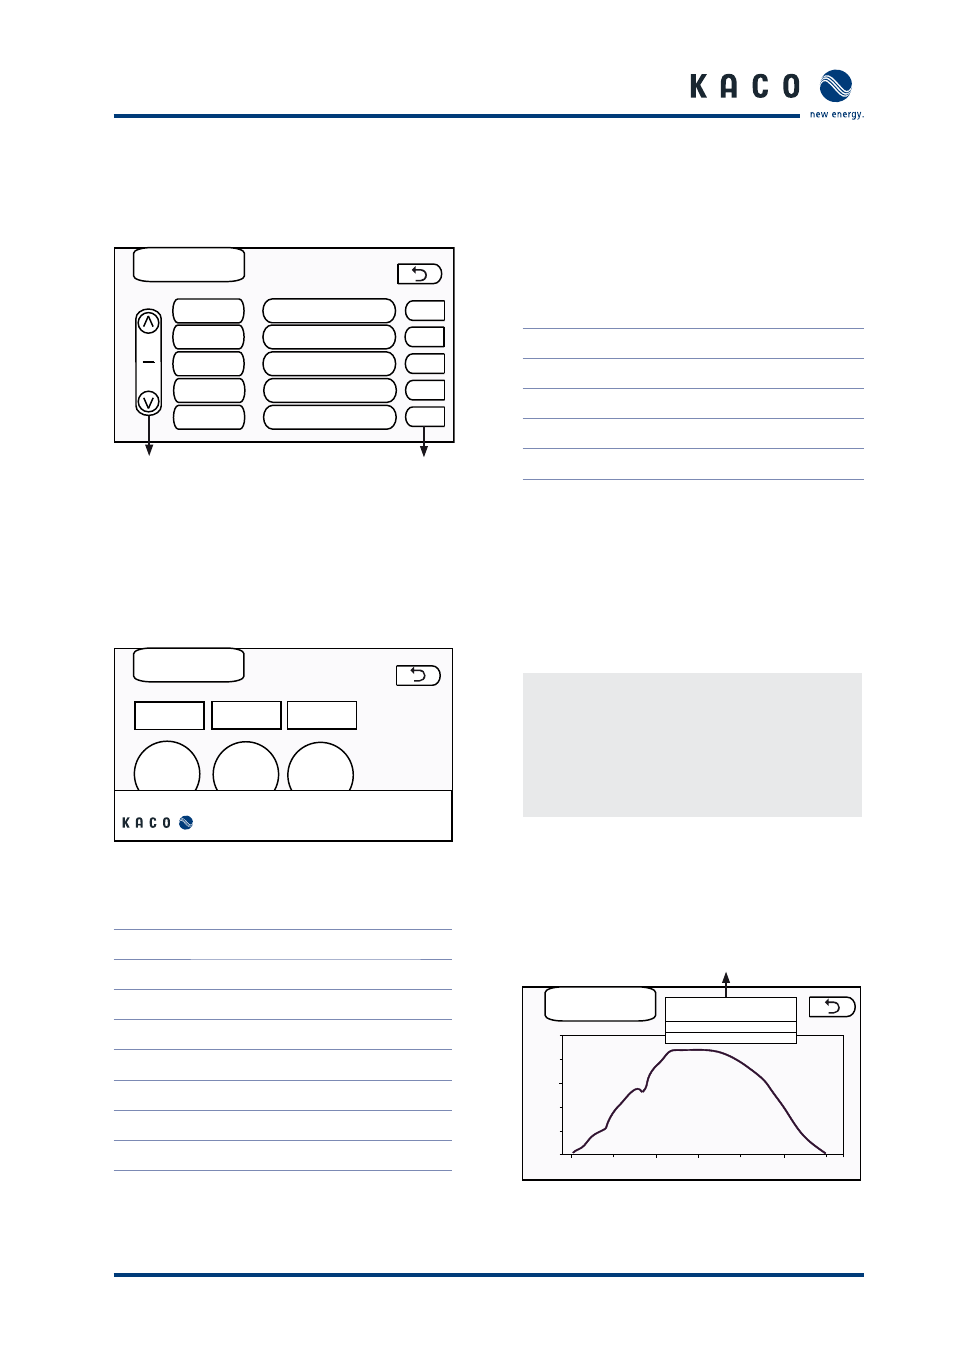
5.9.6 History
This screen displays a list with a maximum of 100 faults, warnings and events that most recently occurred in the
inverter.
2
3
Arrows
Scroll through several pages
Symbols for
types of events
History
L1
L1
L3
L3
E
Date/Time
Description
Icon
Fault type
L1 (yellow)
Warnings
L2
Reserved, currently unassigned
L3 (red)
Serious fault
E
Event
Figure 23: “History” screen
5.9.7 Statistics
The statistics function displays the data that was recorded on the SD card as a diagram.
Day
Specifi c date
Statistics
Month
Year
1.
1.
2010
Select time period
Select one of the three combination fi elds.
Day (daily statistics)
Month (monthly statistics)
Year (annual statistics)
Select a specifi c date.
Figure 24: “Statistics” screen
Statistics display
Parameter
Day
Month
Year
Daily statistics
Grid power
x
x
x
19:00
17:00
15:00
13:00
11:00
09:00
07:00
0
20
40
60
80
100
Parameter selection
Grid power (kW)
Day
Jun 13, 2009
Figure 25: “Day” screen with daily statistics
PV power
x
x
x
PV voltage
x
PV current
x
PV temperature
x
Insolation
x
Line voltage
x