Tendency graph, Tendency graph -57 – RIGOL DM3068 User Manual
Page 99
Chapter 2 Front Panel Operations
RIGOL
User’s Guide for DM3068
2-57
Tendency Graph
The multimeter draws tendency graph of the measured data through which users
can directly observe the variation of the measured data without other
supplementary means. This function is available for DCV, DCI, ACV, ACI, 2WR,
4WR, CAP, FREQ/PERIOD and SENSOR measurements.
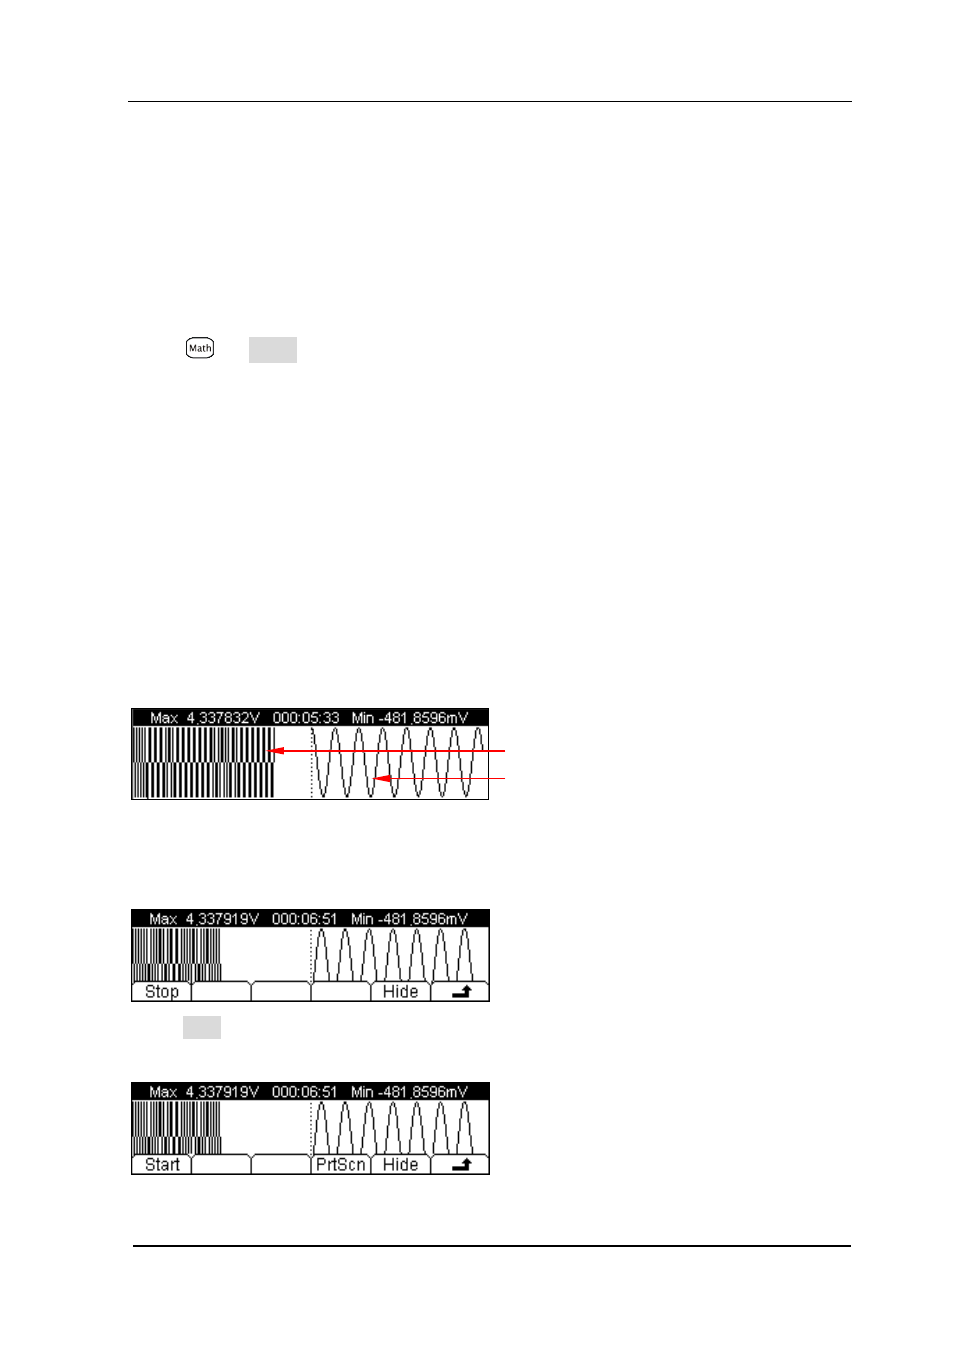
Press
Trend to enter the following interface. The screen displays the MAX
and MIN values of the measured data, the drawing time of the tendency graph as
well as the real-time curve and tendency graph of the measured data. The
multimeter supports up to 999 hours 59 minutes and 59 seconds drawing time.
When the drawing time exceeds this limit, the timer is reset and starts to time
again (but the waveform drawn is kept). When the real-time curve reaches the
maximum display length, it is compressed and added onto the tendency graph and
the multimeter starts to draw new real-time curve. When the tendency graph
reaches the maximum display length, it is compressed into half to make sure that
the compressed data on the real-time curve can be added onto it continuously to
form cumulative tendency graph.
Press any soft menu at this moment to open the operation menu as shown in
figure below.
Press Stop, the multimeter stops drawing and enters the following interface.
Start: enable the multimeter to redraw the graph according to the current
Tendency curve
Real-time curve