6 status | trending graphs – Comtech EF Data LPOD-R User Manual
Page 108
LPOD-R Outdoor Amplifier / Block Up Converter
MN-LPODR
Ethernet-based Remote Product Management
Revision 1
4–22
o
If Enabled, statistics data is averaged at a rate of once per second for 10 seconds.
o
If Disabled, burst values are logged instead of averaged values.
Click Submit to save the changes.
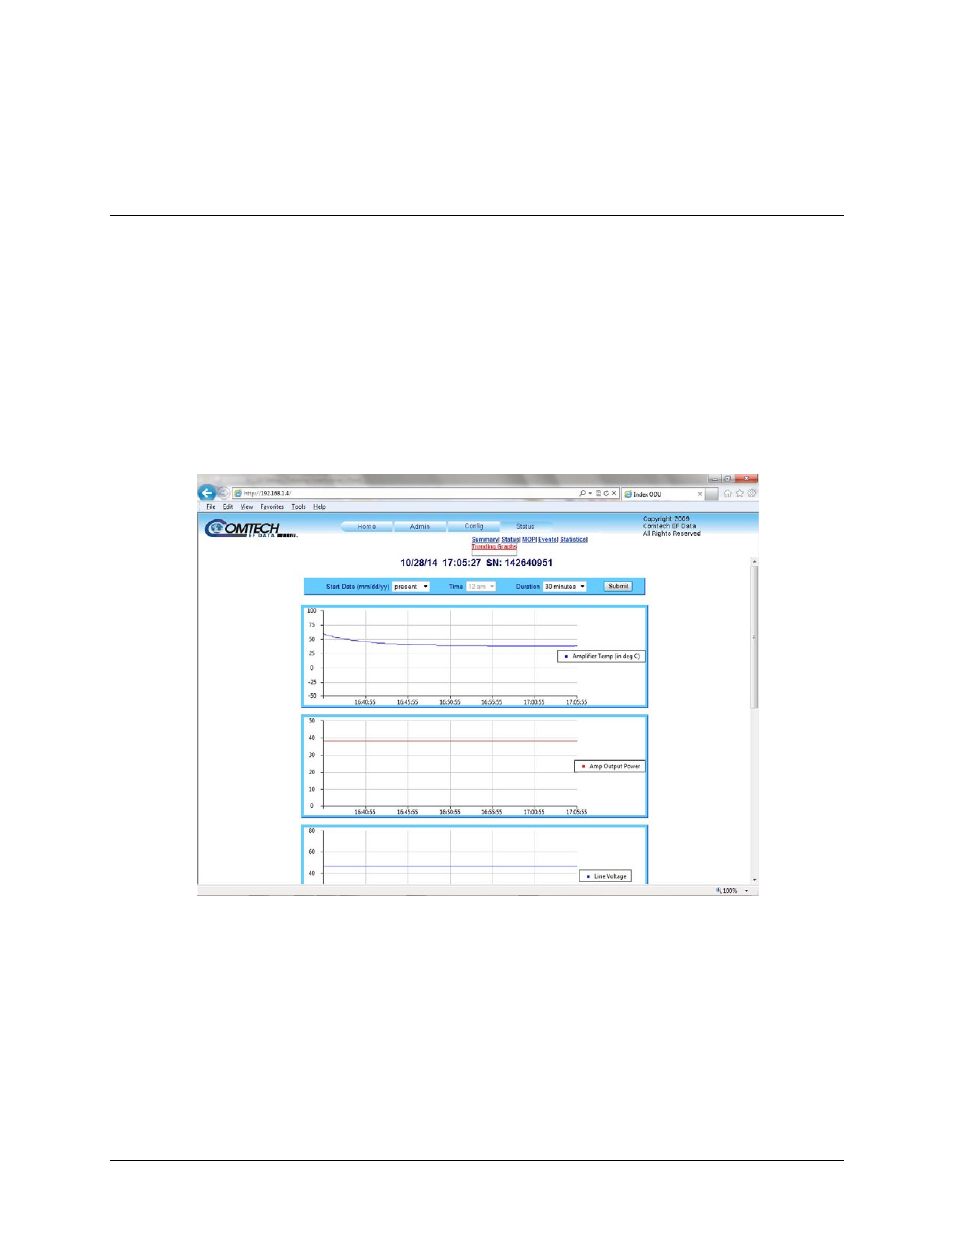
4.4.7.6 Status | Trending Graphs
Use this page to see graphs showing trends over time for several operating parameters. You can
select the time settings for the graph also. Graphed operating parameters include:
• Amplifier Temperature
• Amplifier Output Power
• Line Voltage
• Line Current (Amp)
• Fan Voltage
• Fan Current (mA)
Refresh the page to see the latest data.
Figure 4-11. Status | Trending Graphs Example
Trending Graph Time Settings
• Start Date (mm/dd/yy) – Use the drop-down list to select present or a specific date.
• Time – If the Start Date is a specified date, select the starting Time for that date.
• Duration – Use the drop-down list to select a duration period for the graph statistics.
Click Submit to save the new settings.