Gasboy SiteOmat Maintenance Manual User Manual
Page 150

146
SiteOmat Setup and Maintenance Manual – MDE 4817G
c. Send to Device: Sends the strapping table to the TLG. It is highly recommended to inspect
the results and then update the device.
d. Refresh: Updates the data displayed on the screen
e. Graphs: See paragraph 7-7.5.1
f. Settings: Defines advanced setting parameters
g. Close: Closes the dialog box
7-7.5.1. Tank Calibration Graphs
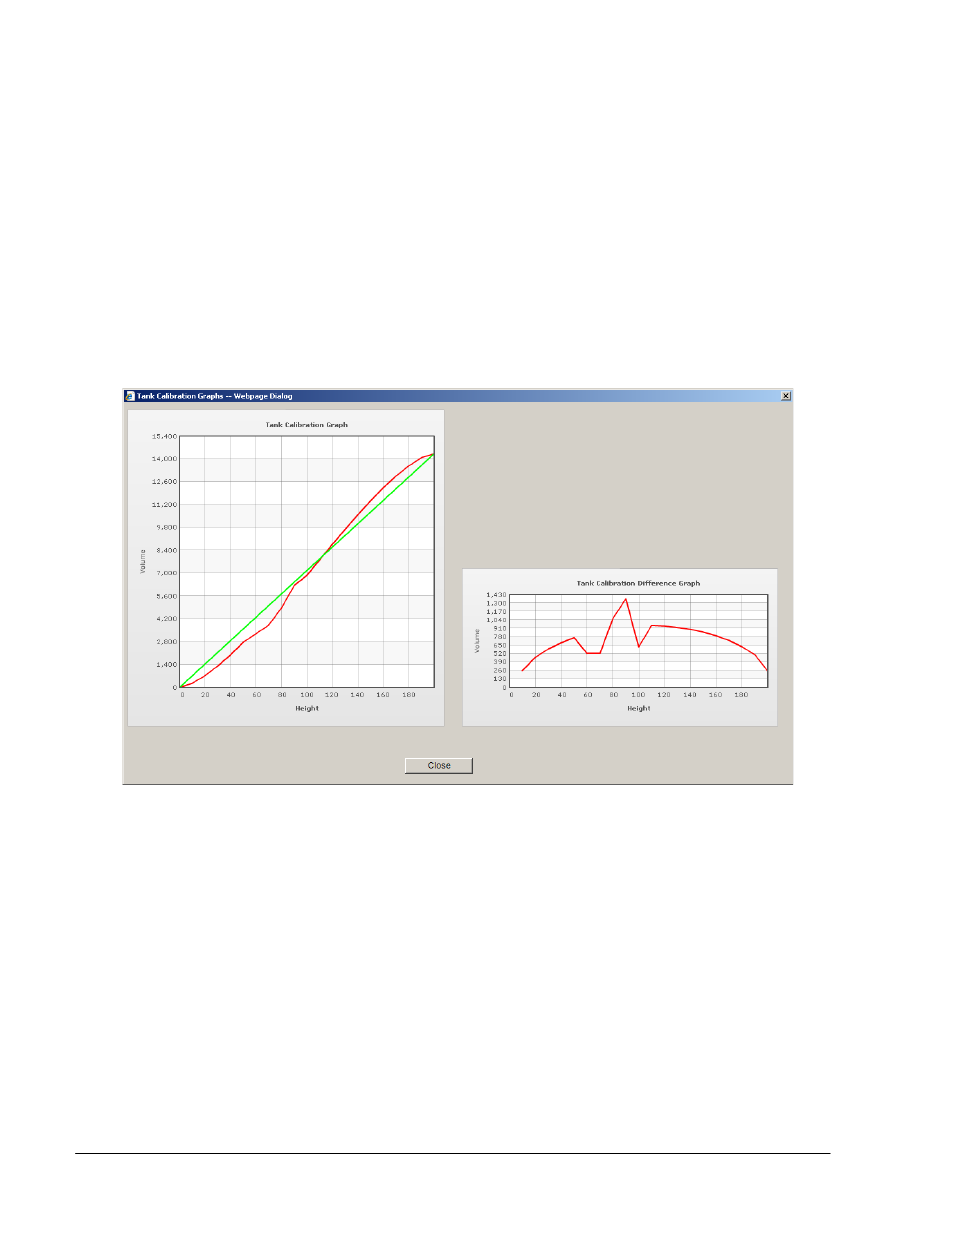
Clicking on the Graphs button opens the following dialog box (see Figure 7-17).
Figure 7-17. Tank Calibration Graphs Dialog Box
The Tank Calibration Graph on the left side displays the strapping table volume as a function of
high, in red, over a green reference line.
The Tank Calibration Difference Graph displays the difference in volume between two points as a
function of height, based on the strapping table.
Click on the Close button to close this dialog box and return to the Auto Calibration Data dialog
box.