How to view the ecg waveform – Fluke Biomedical ProSim 6 User Manual
Page 25
Vital Signs Simulator
ECG Function
13
3. Push or to adjust the deviation. Each push of a key moves the deviation 0.05 or
0.1 mV in the direction of the key pushed. The deviation range is
±
0.80 mV
Note
When the ST Deviation value is set to 0.00 mV, the value in ECG screen
will show as Off.
4. Push to set the deviation and go back to the ECG screen.
To set the ECG signal amplitude:
1. Push or to move the highlight in the display to the Amplitude value.
2. Push .
3. Push or to adjust the amplitude. Each push of a key increases or decreases the
amplitude 0.05 mV between 0.05 and 0.50 mV and 0.25 mV above 0.50 mV to
5.00 mV in the direction of the key pushed.
4. Push to set the signal amplitude and go back to the ECG screen.
Table 9 shows the percentage of the signal amplitude value that is put on each ECG lead.
Table 9. ECG Lead Amplitudes
Waveform
I II III V1 V2 V3 V4 V5 V6
Performance
[1]
70 %
100 %
30 %
100 %
100 %
100 %
100 % 100 % 100 %
Normal Sinus
70 %
100 %
30 %
24 %
48 %
100 %
120 % 112 %
80 %
Normal Sinus,
Horizontal Axis
100 %
30 %
-70 %
20 %
40 %
70 %
100 %
80 %
50 %
Normal Sinus,
Vertical Axis
30 %
130 %
100 %
20 %
30 %
40 %
60 %
80 %
100 %
[1]
Includes R-Wave Detection, QRS Detection, and Tall T-Wave Rejection waves.
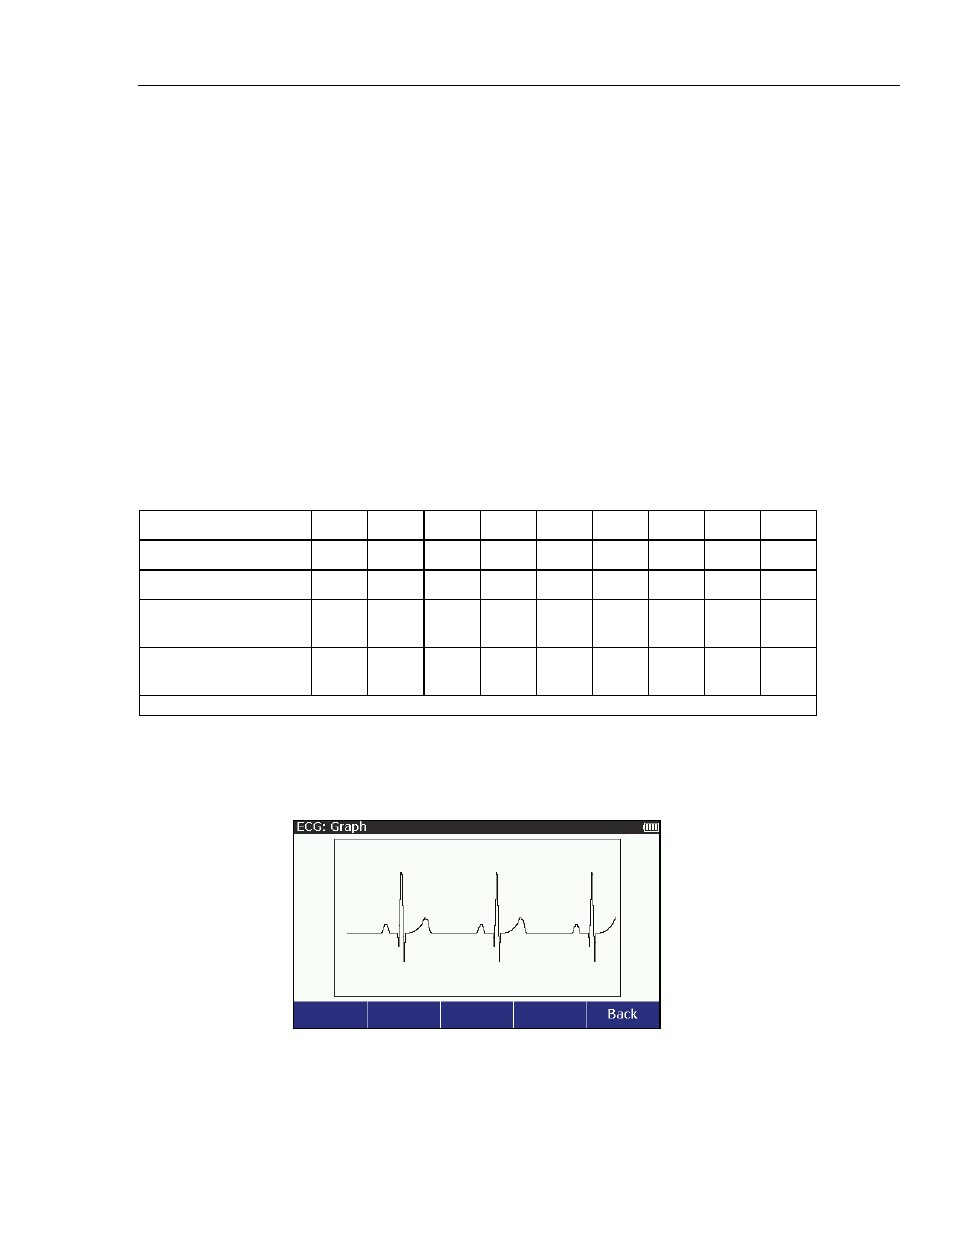
How to View the ECG Waveform
As you adjust the ECG signal, you can see the signal in the display. To see the ECG
signal, from the ECG screen, push the Graph softkey. The graph screen in Figure 8
shows in the display.
glh023.bmp
Figure 8. ECG Graph Screen
The ECG signal is shown in the display in real time.
Push the Back softkey to go back to the ECG screen.