Data line monitor configuration table, Data line monitor configuration table -19 – Verilink WANsuite 5165 (34-00301.H) Product Manual User Manual
Page 49
W e b S e r v e r I n t e r f a c e
3-19
•
Up
−
The service is ready to pass data.
•
Idle
−
The service has nothing to do.
The table in the center of the screen displays the available services listed by
index number. To view more detailed information about a service, click on
the index number associated with the desired service on the Services screen
and then click on one of the user-activated “Details” buttons on the Service
Details screen as described on page 3-21.
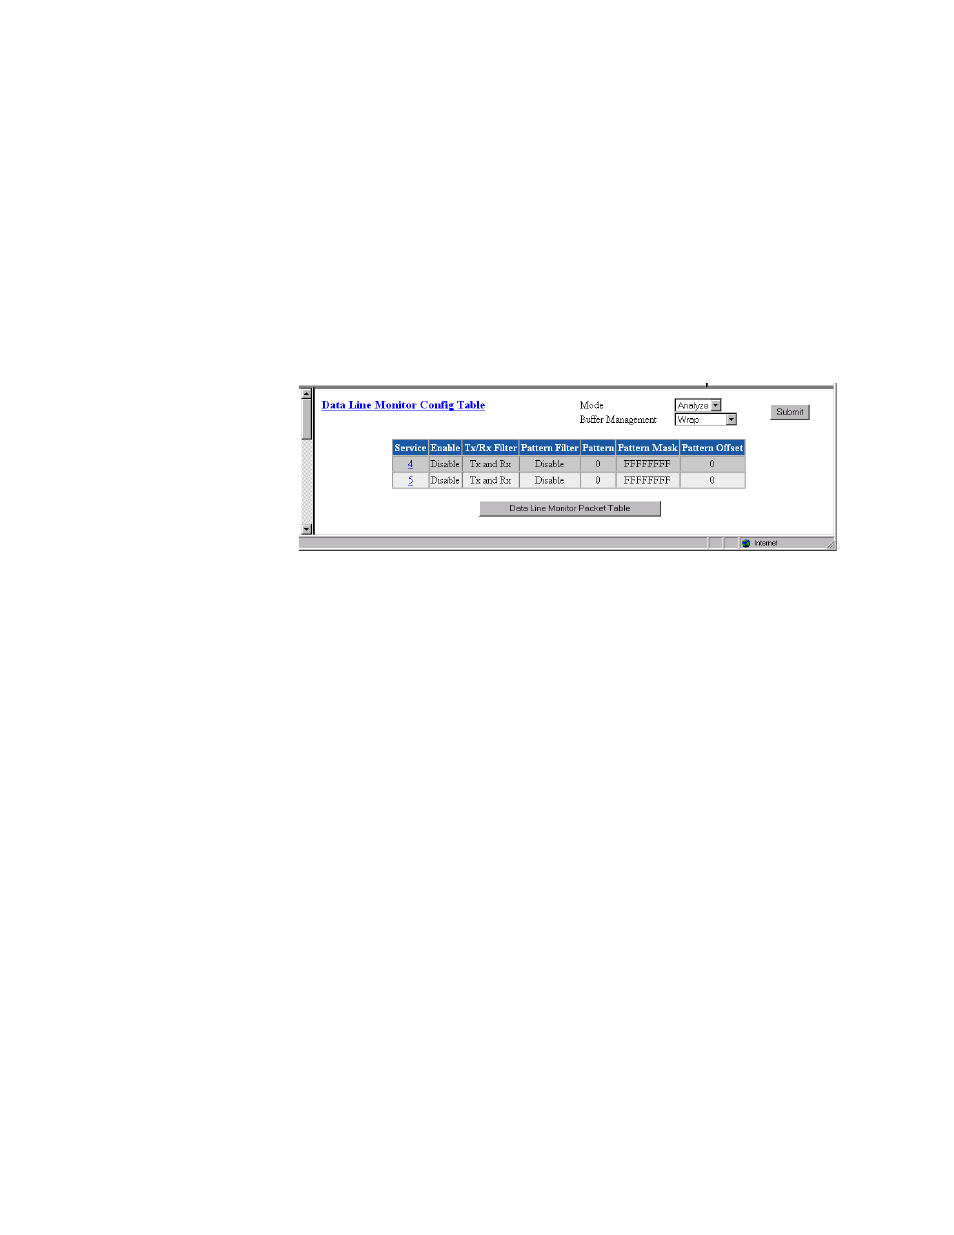
Data Line Monitor Configuration Table
Click on the Data Line Monitor Config Table button at the top of the Service
screen to view a screen that displays SCADA port information (Figure 3.16).
Figure 3.16
Data Line Monitor Config Table
Mode
The two modes available are “Analyze” and “Live.” The Live mode lets you
capture data and create a usable text file of the captured data. In Analyze
mode, the packet switch will return the data via the Data Line Monitor Packet
Table (see Figure 3.17) whereas in the Live mode the Data Line Monitor
Packet Table will appear empty for SNMP calls.
Buffer Management
Displays whether displayed data is set to “Wrap” or “Stop on Full.”
Service
Indicates which service is being monitored.
Enable
Displays whether capture is Enabled or Disabled.
Tx/Rx Filter
Displays the direction of the captured data.
Pattern Filter
Displays the Enable/Disable status of the Packet Filter.
Pattern
Displays which specific pattern is being searched for.
Pattern Mask
Displays the bits the unit is looking for.
Pattern Offset
Displays the offset in the packet that matches the pattern. If the offset is set to
255, the filter will search the packet for the pattern.
Click on the “Data Line Monitor Packet Table” button at the bottom of the
screen to view the table that displays the captured data. The screen shows