Control buttons – Xtramus NuWIN-RM V1.4 User Manual
Page 46
46
E-mail: [email protected]
Website: www.Xtramus.com
XTRAMUS
®
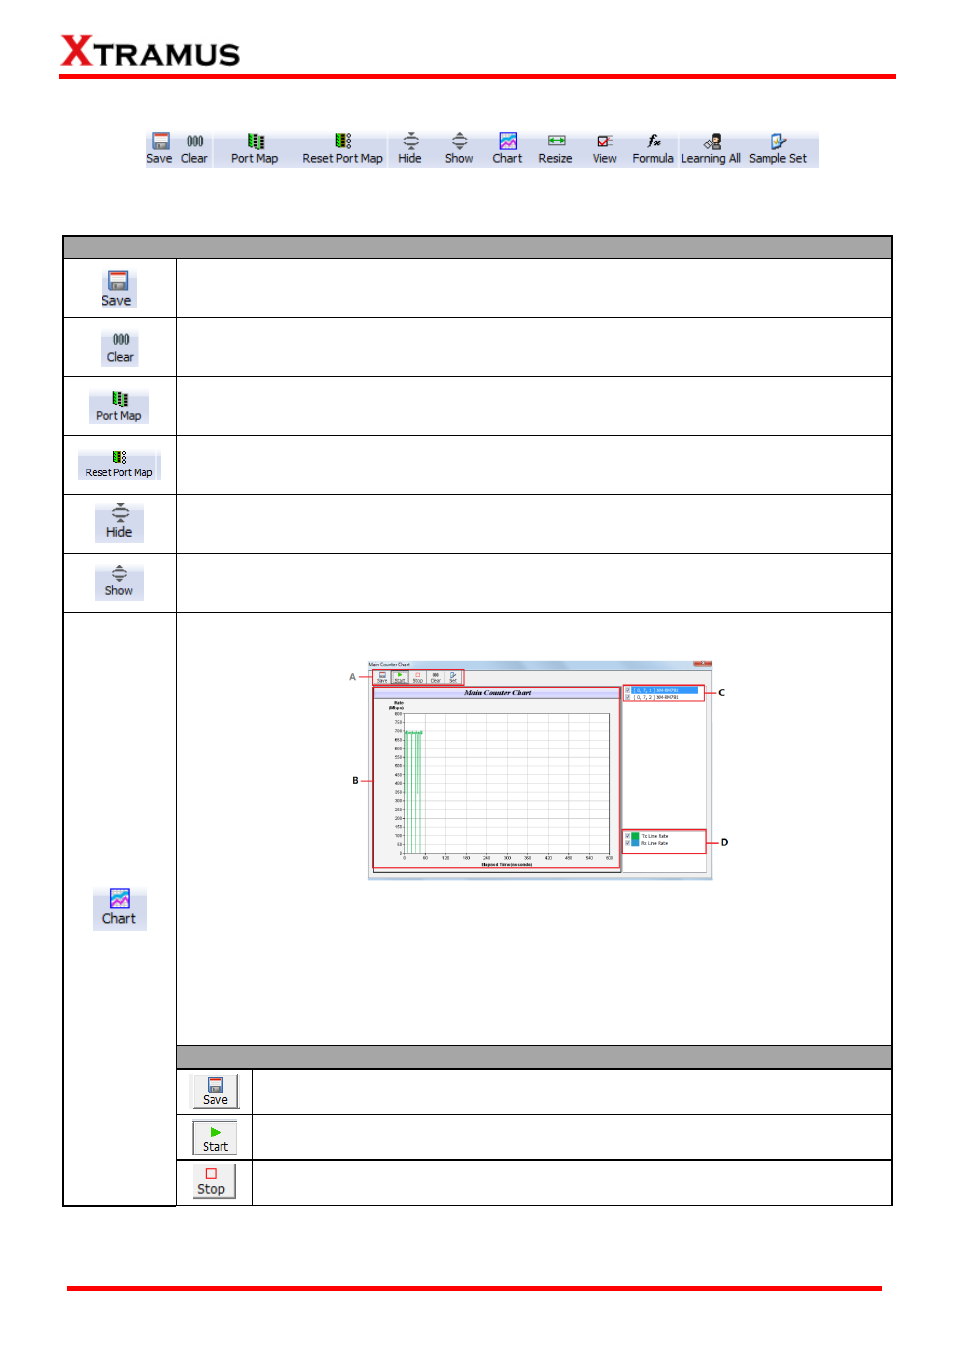
6.3.1. Control Buttons
Please refer to the section down below for more detail descriptions regarding to the following contents.
Control Buttons Descriptions
The Save button allows you to save the current counter reports to Microsoft Excel® format
files.
The Clear button allows you to clear all statistics displayed on the Main Display Screen.
The Port Map button allows you set the ports the statistics of which you want to view. Only
the statistics of the selected ports will be displayed in the Main Display Screen.
The Reset Port Map button allows you to clear all the ports you selected in the Port Map.
The Hide button allows you to hide some of the TX/Rx statistics, as well as fold all tree style
tab statistics on the Main Display Screen.
The Show button allows you to show all TX/Rx statistics, as well as unfold all tree style tab
statistics on the Main Display Screen.
The Chart button allows you to intuitively view the general trend of the TX/Rx line rate of the
reserved port, shown as the picture down below.
You can select the ports in C and choose the rate type in D. The rate type including Tx Line
Rate and Rx Line Rate. And the colors of the corresponding rate are shown in D. Then
click the Start button in A to plot the chart.
Taking the above figure for an example, the Elapsed time-Rate chart of port (0, 7, 1)
XM-RM781 will be plotted in B after click the Start button and in the chart, there will be one
green line and a blue line, respectively representing the Tx Line Rate and Rx Line Rate.
And you can operate the chart through the operation buttons in A. For more information,
see Operation buttons.
Operation buttons
Save the current chart in
“.bmp” format.
Start to plot the chart.
Stop to plot the chart.