Super Systems Paperless VR User Manual
Page 66
Super Systems Inc.
Page 65 Video Recorder Manual Version 2 Rev. B
The curves in the
“Curves:” section are
the curves that have
been downloaded from
the screen or created
on the computer. To
edit a curve, select the
curve from the list and
then click on the Edit
button. To add a curve,
click on the Add button.
When the Edit or Add
button has been clicked,
the rest of the screen
will become visible.
The user can now begin
entering information
about the curve. The
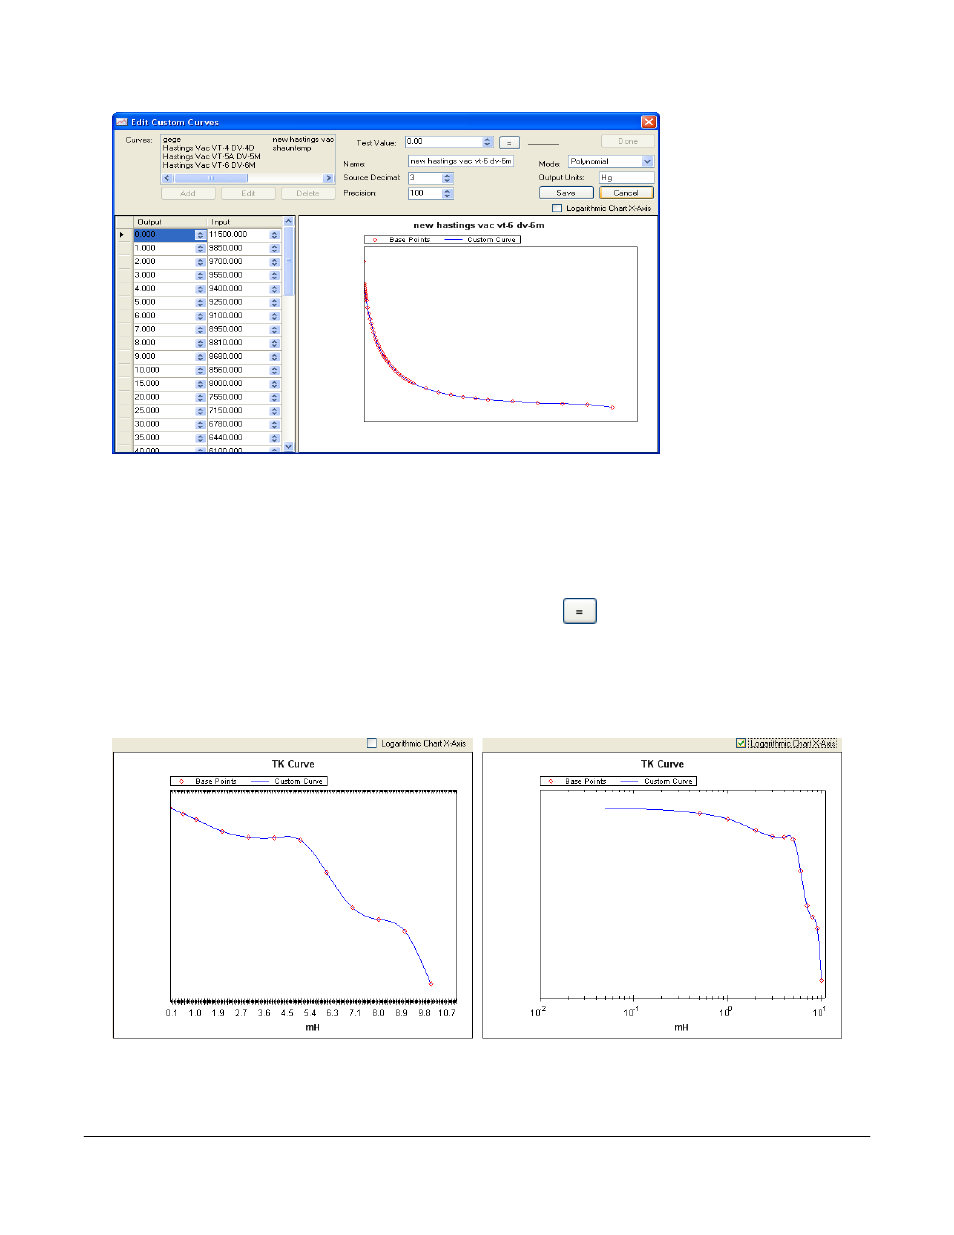
“Output” column
represents the X-Axis on the graph, and the “Input” column represents the Y-Axis on the graph. The
output is the value that will be output if a certain input is received. For example, using the graph above, if
an input value of 8000.000 is received, the corresponding output would be 15.000. Values between the
points will be curved to accommodate. For example, again using the graph above, if an input value of
8400.000 is received, then the corresponding output would be 11.35. As points are entered in the
“Output/Input” area, the graph on the right will add those points to it and the graph with the curve will
begin to take shape. The “Test Value” field at the right will allow the user to test out the curve with
sample input values. Clicking on the button with the equals sign,
, will display the output value to the
right of the button. The “Name” field will set the name of the curve. The “Source Decimal” field will set
the number of decimals for the source, with a range of 0 to 4. The “Precision” field will set the precision,
with a range of 1 to 1000. The “Mode” field will set the mode of the curve, and it can be either Linear or
Polynomial. The output units will describe what kind of units the output will be in. The “Logarithmic
Chart X-Axis” box will convert the graph into a logarithmic function, as seen below.
Click the Save button to save the changes or add the curve. Click the Cancel button to cancel any
changes.