Tabular data, Editing a chart in vr manager – Super Systems Paperless VR User Manual
Page 67
Super Systems Inc.
Page 66 Video Recorder Manual Version 2 Rev. B
Clicking on the Delete button will delete the curve. The user will have to confirm the delete.
Clicking on the Done button will close the screen.
The Show Notes toolbar button,
, will show any notes on the screen. A note is
signified by the note icon,
, on the graph. Clicking on the note icon on the graph
will expand the note and display the note’s contents.
The top date/time is the date/time the note was made for, and the bottom date/time
is when the note was created.
Tabular Data
Tabular data can be reviewed by using the Show
Data Grid
button on the toolbar. The data that
is displayed on the screen will be defined by the
start and stop time displayed on the screen and
the data points will be selected in intervals defined
by the
Customize Chart Interval
menu option
under the
Tools
menu option.
To print tabular data, simply choose the print
option through the
File
menu or the Print button on the screen.
To return to the trend view, select the Show Chart button
on the tool bar.
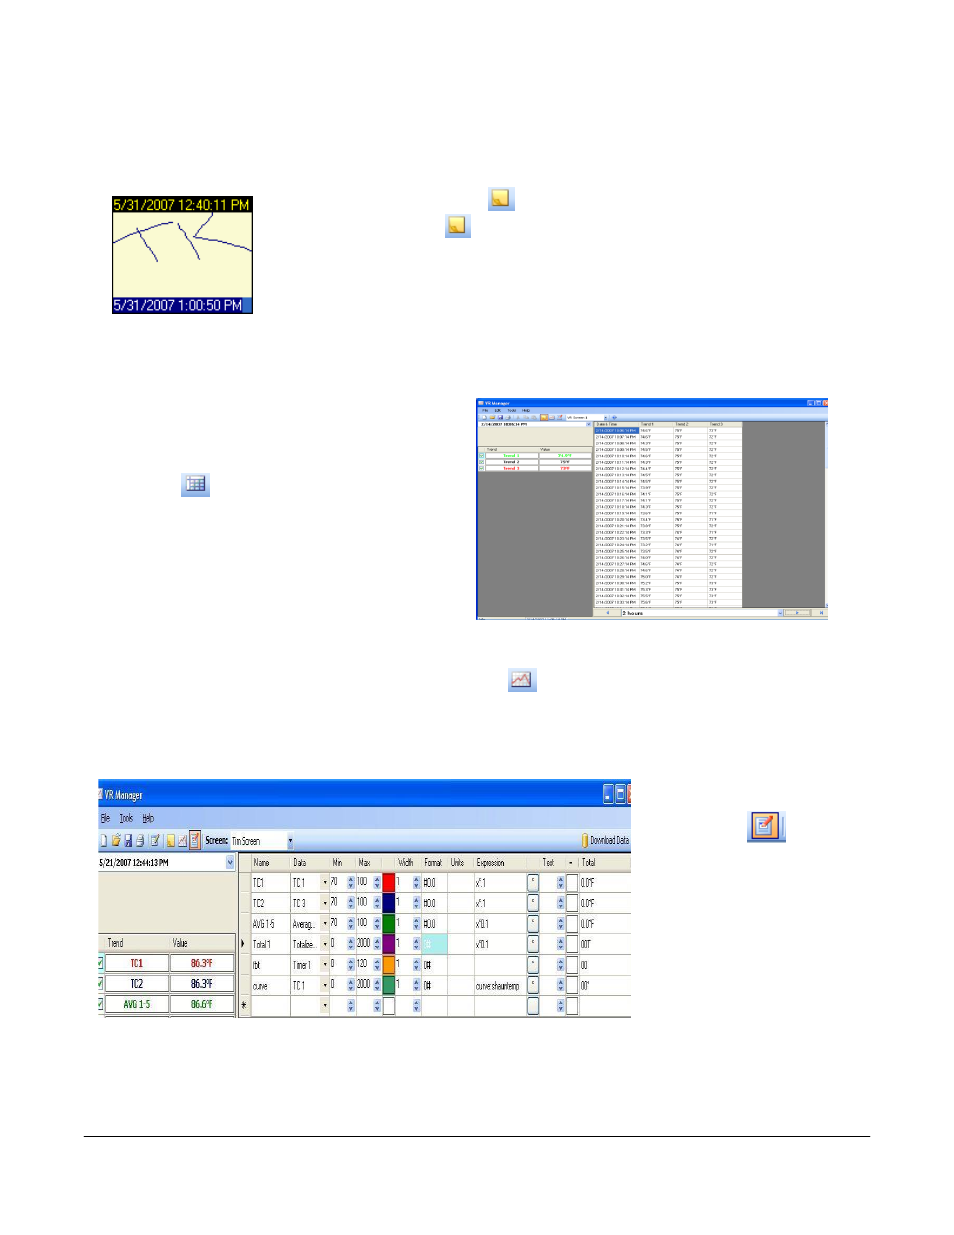
Editing a Chart in VR Manager
To edit a chart in VR
Manager, use the Edit Chart
toolbar button
. This
will display the current
trend chart definition
screen. Trend data can be
modified so that when using
this chart through VR
Manager the trend data will
be using these definitions.
Click on the Edit Chart
button again to return to the
Trend Chart view.
Name – User defined field for trend / input.
Data – The input number used from the data logging device.