Graphic view – CIRCUTOR CVM-B Series User Manual
Page 92
Back, returns to the demand parameters display screen,
figure 74.
Main Menu, back to the main menu,
figure 25
.
Use the keys
and
to browse the different options.
To access the option selected press the key
.
5�1�3�1�3�1�1�-
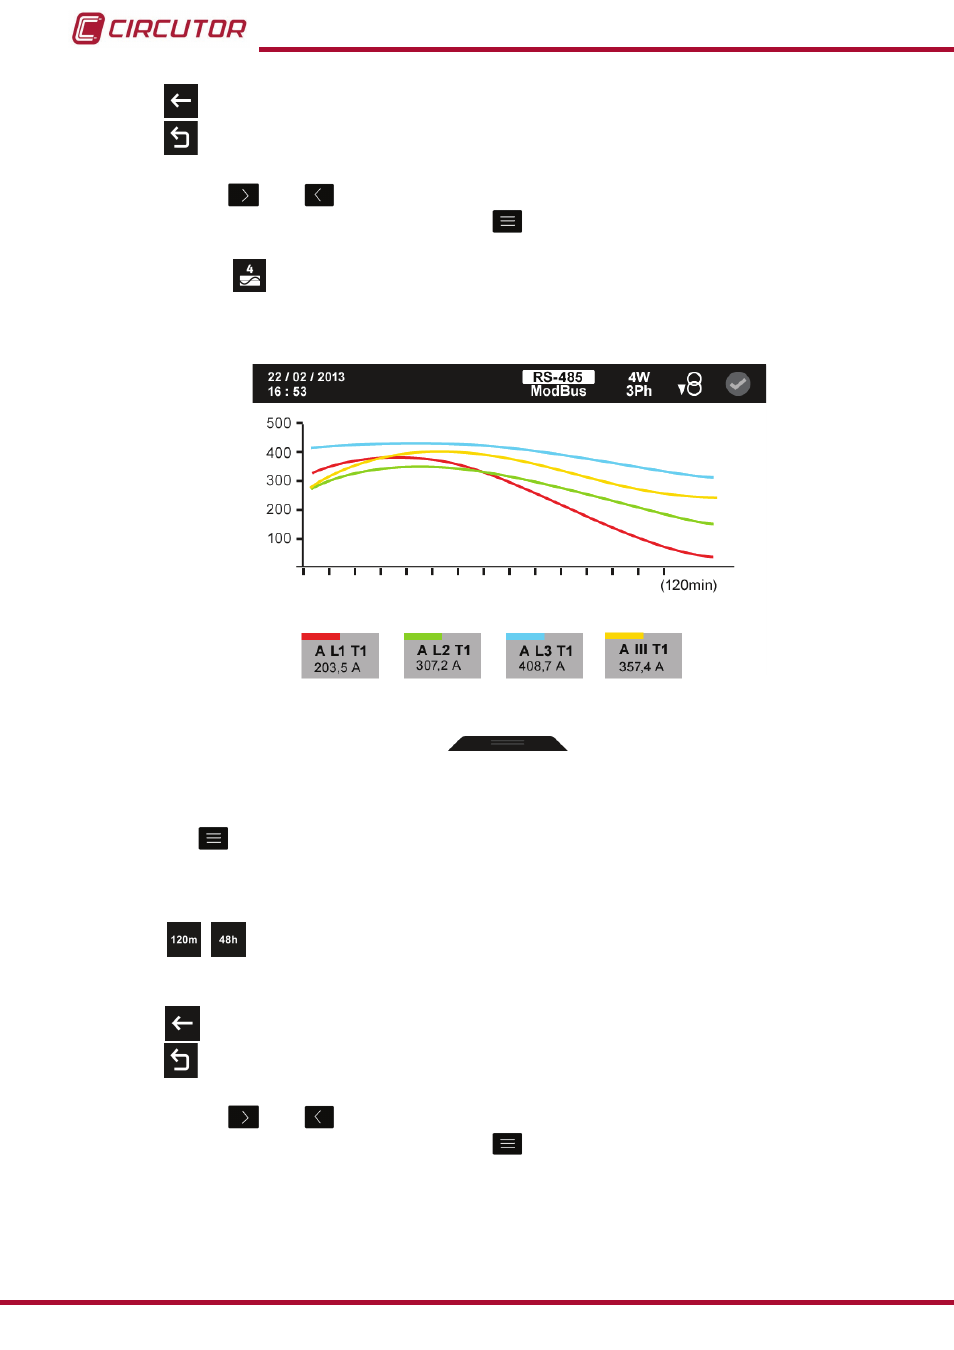
graphic view�
figure 76
shows the graphical display screen .
figure 76: Demand parameters, graphic view (displays 4 parameters)�
The menu in the lower area disappears after a few seconds.
Press the
key to display the lower area again.
The lower area menu options are:
,
, Select the integration time ( X-axis ) on the graph. The time can be set to 120
minutes or 48 hours.
Note: The option selected is not displayed on the menu.
Back, returns to the demand parameters display menu screen,
Main Menu, back to the main menu,
figure 25
.
Use the keys
and
to browse the different options.
To access the option selected press the key
.
92
CVM-B100 - CVM-B150
Instruction Manual