Adobe Illustrator CC 2015 User Manual
Page 34
29
Workspace
Last updated 6/5/2015
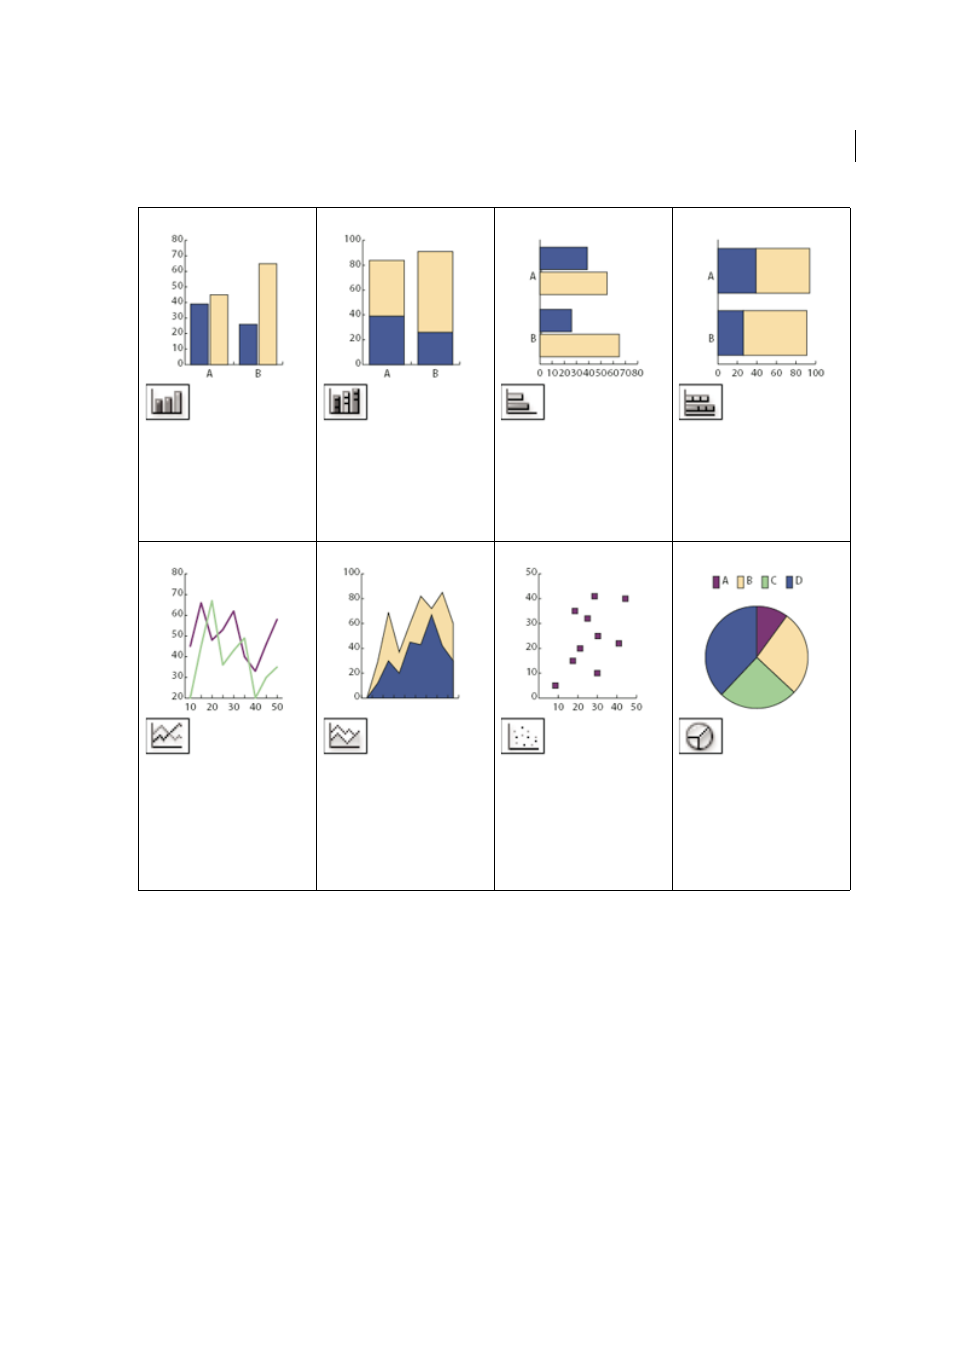
The Column Graph tool (J) creates
graphs that compare values using
vertical columns.
The Stacked Column Graph tool
creates graphs that are similar to
column graphs, but stacks the
columns on top of one another,
instead of side by side. This graph
type is useful for showing the
relationship of parts to the total.
The Bar Graph tool creates graphs
that are similar to column graphs,
but positions the bars horizontally
instead of vertically.
The Stacked Bar Graph tool creates
graphs that are similar to stacked
column graphs, but stacks the bars
horizontally instead of vertically.
The Line Graph tool creates graphs
that use points to represent one or
more sets of values, with a different
line joining the points in each set.
This type of graph is often used to
show the trend of one or more
subjects over a period of time.
The Area Graph tool creates graphs
that are similar to line graphs, but
emphasizes totals as well as
changes in values.
The Scatter Graph tool creates
graphs that plot data points as
paired sets of coordinates along the
x and y axes. Scatter graphs are
useful for identifying patterns or
trends in data. They also can
indicate whether variables affect
one another.
The Pie Graph tool creates circular
graphs whose wedges represent the
relative percentages of the values
compared.