Televes Serie H-60 User Manual
Page 58
58
Measures Config.
3.3.1.6.4.- Graphs
The “
graphs
” function allows one to save a graphs onto the memory. This graphic may be a
spectrum in any of its configurations or a representation of the DVB-T ECHOES diagram. These
graphs can be seen on the meter or transferred to the SD card (only some options) or
downloaded via HSuite for subsequent use (transferring onto Excel
®
, printing, etc…).
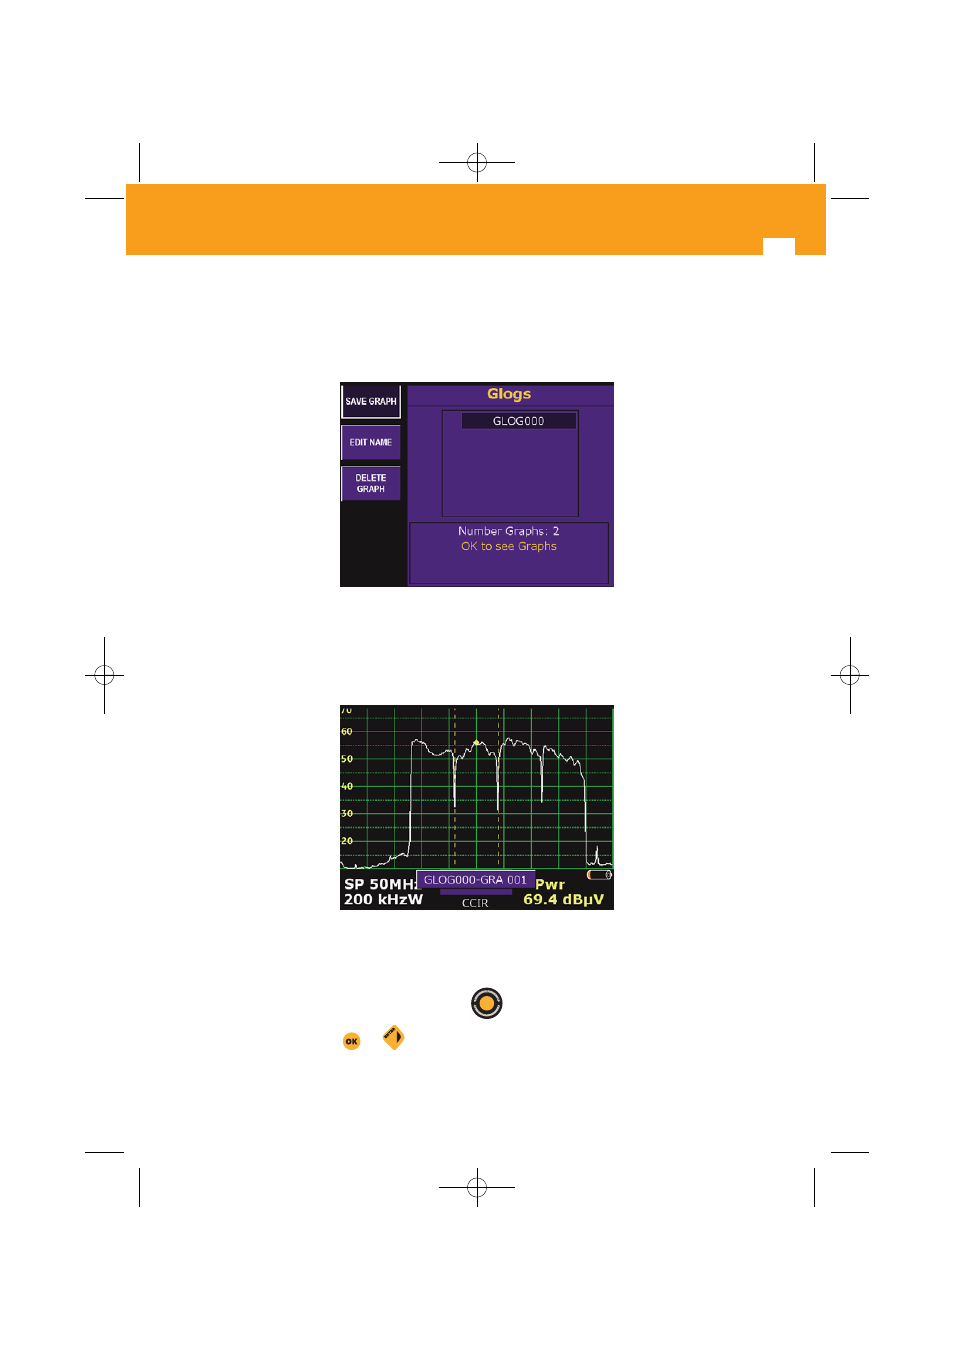
- Stored GLOGs -
The graphs that have been stored on the meter will appear on screen when pressing the Graphs
key and using the
Save Graphic
function (see paragraph 3.3.1.6.4.1).
- A GLOG graphic -
The graphs are organised within the meter as directories or so-called
GLOGS
. To view a
GLOG
in particular one must first select it using the
to move around and once on the one we
wish to view press the
or
key. Once we have pressed the relevant key all the graphs
01031052_002_EN:103130_00.qxd 10/07/2013 8:00 Página 58