Daktronics Show Control System User Manual
Page 122
115
Daktronics Show Control System
Dashboard
Expanded View
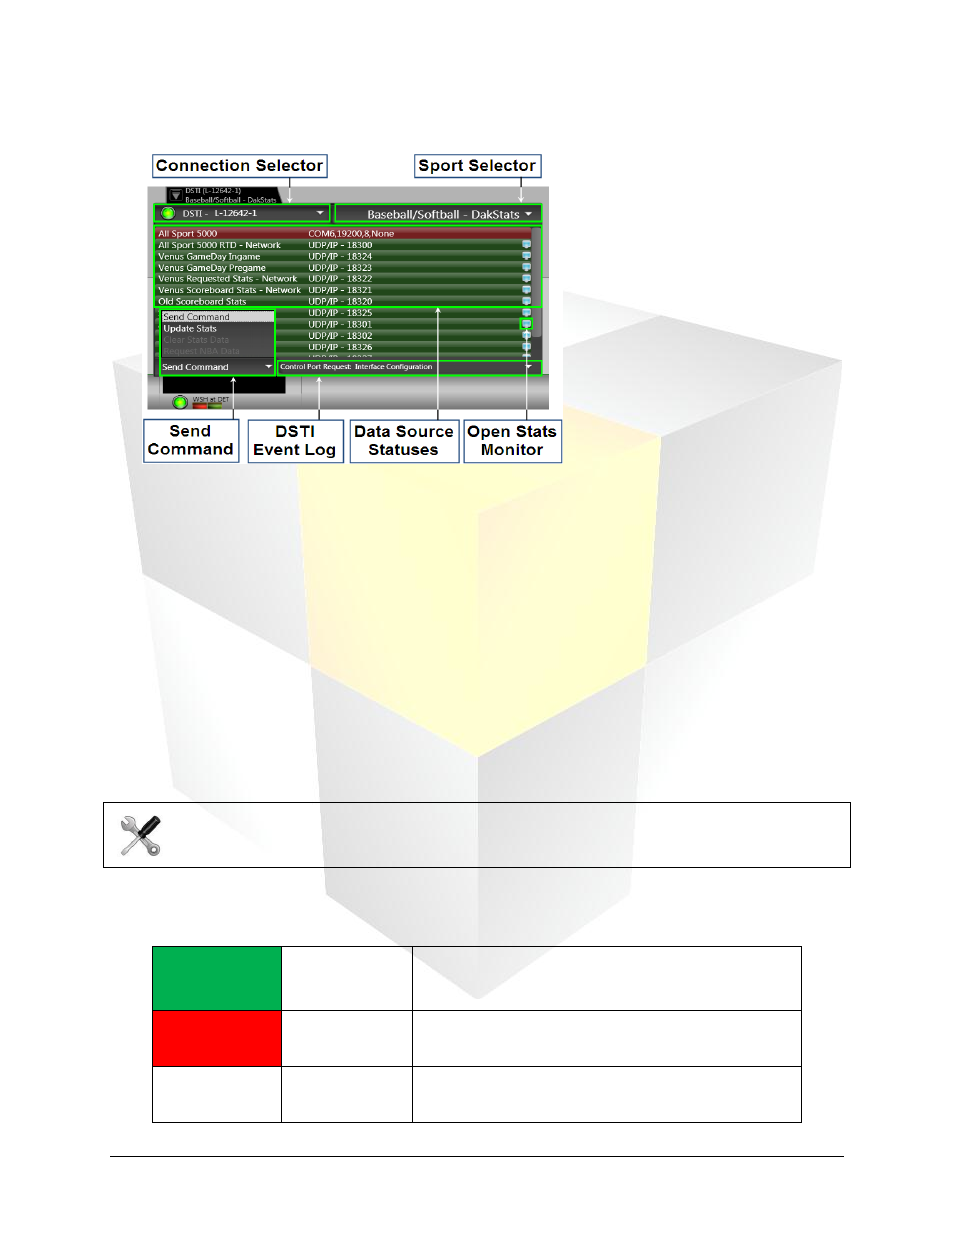
Connection Selector: Indicates the DSTI system from which you are receiving data. If your Show
Control System is connected to multiple DSTIs, a drop-down menu will be available to allow you to
select the DSTI system with which you wish to interact
Sport Selector: A drop-down menu for selecting the sport for which you want to receive data
Send Command: A drop-down menu for sending commands to the DSTI system.
Update Stats: The system will update all data.
Clear Stats Data: The system will clear all data currently stored.
Request NBA Data: The system will submit a request to receive NBA statistical data.
DSTI Event Log: Provides the DSTI’s event history since connecting to the system.
Data Source Statuses: The color of each data source listed indicates the status of your system’s
connection(s) to DSTI. For more information on the data source statuses, see
Open Data Monitor: Click to open the Data Monitor for the corresponding data source.
DSTI Status Colors
The DSTI Widget represents the status of data source connections with the following colors:
Green
Active
Indicates that the connection is active. The connection
indicator will pulse when data is being received.
Red
Error
Indicates there is a connection, but that there is an
error.
White
Not Connected
Indicates that you are not connected to the data
source.
Tech Note: If your system is not connected to DSTI, many of the options in the widget will not
be available.