Wavecom W74PC V8.7.0 User Manual
Page 104
94
Analysis Tools
WAVECOM Decoder W74PC, W-PCI/e, W-CODE, W-CLOUD Manual V8.7.0
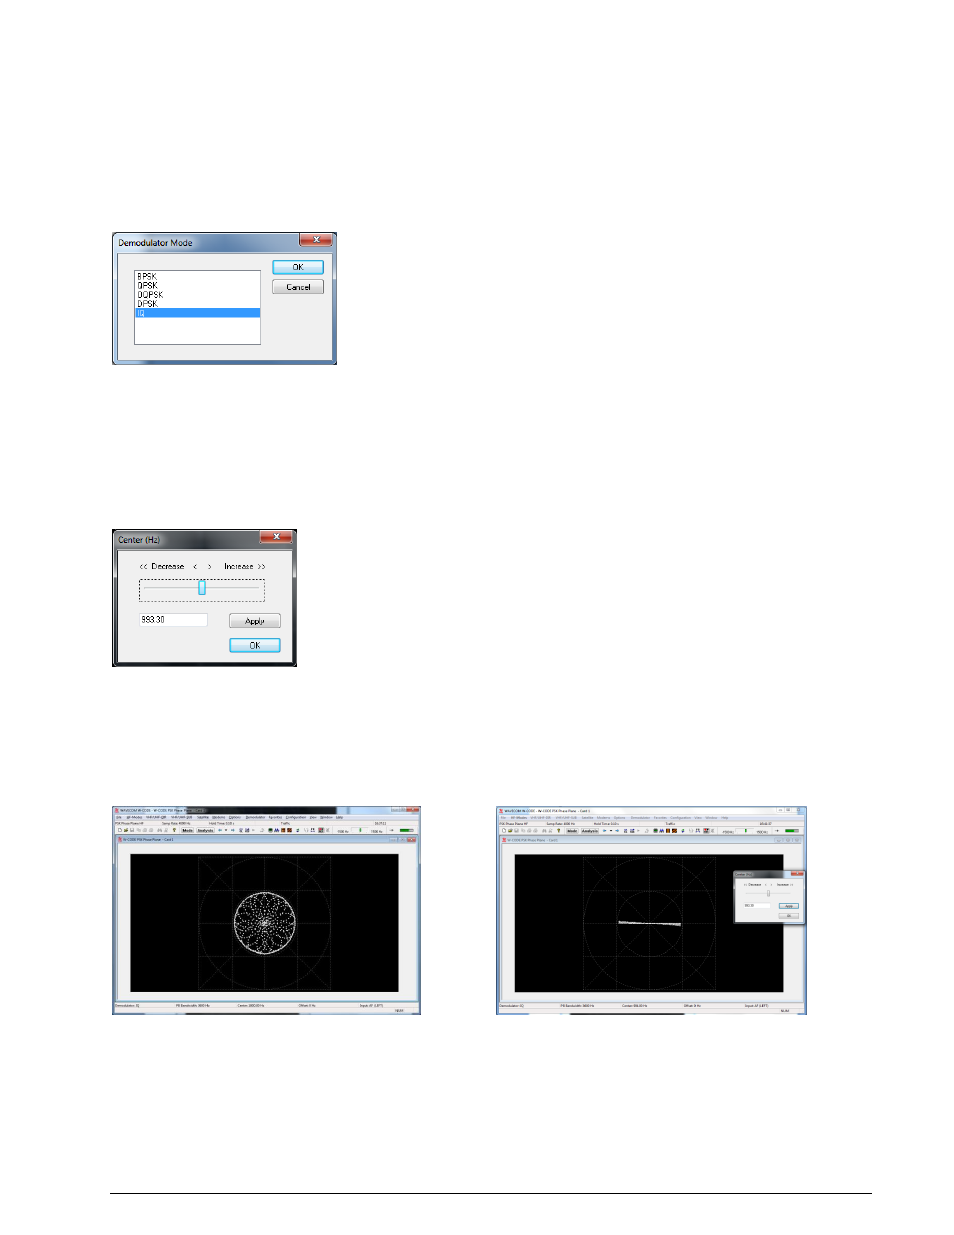
Center
The Center allows the center frequency for the demodulator to be adjusted. A center frequency error nor-
mally results in a phase plane that is rotating with a speed proportional to the frequency error.
Hold Time
The Hold Time adjusts the number of points displayed on the screen. Increasing the hold time increases
the amount of time a dot will remain in the image before being overwritten by a new value.
Demodulator Mode
If you select IQ as the demodulator, the signal is not demodulated at all. Instead, the phase of the signal
is visually 'compared' with a reference signal. Providing the correct reference signal is selected, this will
result in a phase display that provides an indication of the type of PSK or PAM signal. The points will trace
the path taken as the signal phase change. At the nominal signal mapping points, there is normally an ac-
cumulation of data points, providing a visual clue to the overall signal mapping.
Multi-channel DPSK signals often have a very narrow channel signal bandwidth. This results in the phase
of the signal never remaining constant, and so the accumulation of signal points in the phase plane is not
visible. To quantify such signals use the IQ demodulator mode.
The frequency of the reference signal is set using the Center option. Note that if the reference frequency
is incorrect, the display rotates at a rate that is the difference between the reference frequency and the
true carrier frequency of the signal. When adjusting the reference signal, the changes are 'live'. This
means that changes you make immediately take effect, and the resulting change in the phase display is
immediately visible on the display.
Incorrect settings
Correct settings
Several Color schemes for both tools are available through the right-click menu.
In summary, the basic steps for analyzing a suspected (D)PSK signal are as follows:
Use the FFT in the PSK Symbol Rate analysis tool to characterize the signal. Use the cursors to
configure the estimate of the center frequency and bandwidth.
Use the PSK Symbol Rate analysis tool to measure and select the symbol rate of the signal.