Waterfall (hf, sub, dir and sat), Sonagram – Wavecom W74PC V8.7.0 User Manual
Page 93
WAVECOM Decoder W74PC, W-PCI/e, W-CODE, W-CLOUD Manual V8.7.0
Analysis Tools
83
Options can be set using the right mouse button or the context menu (see “
on page 71). It is possible to remove the tuning FFT or Sonagram in the View Menu.
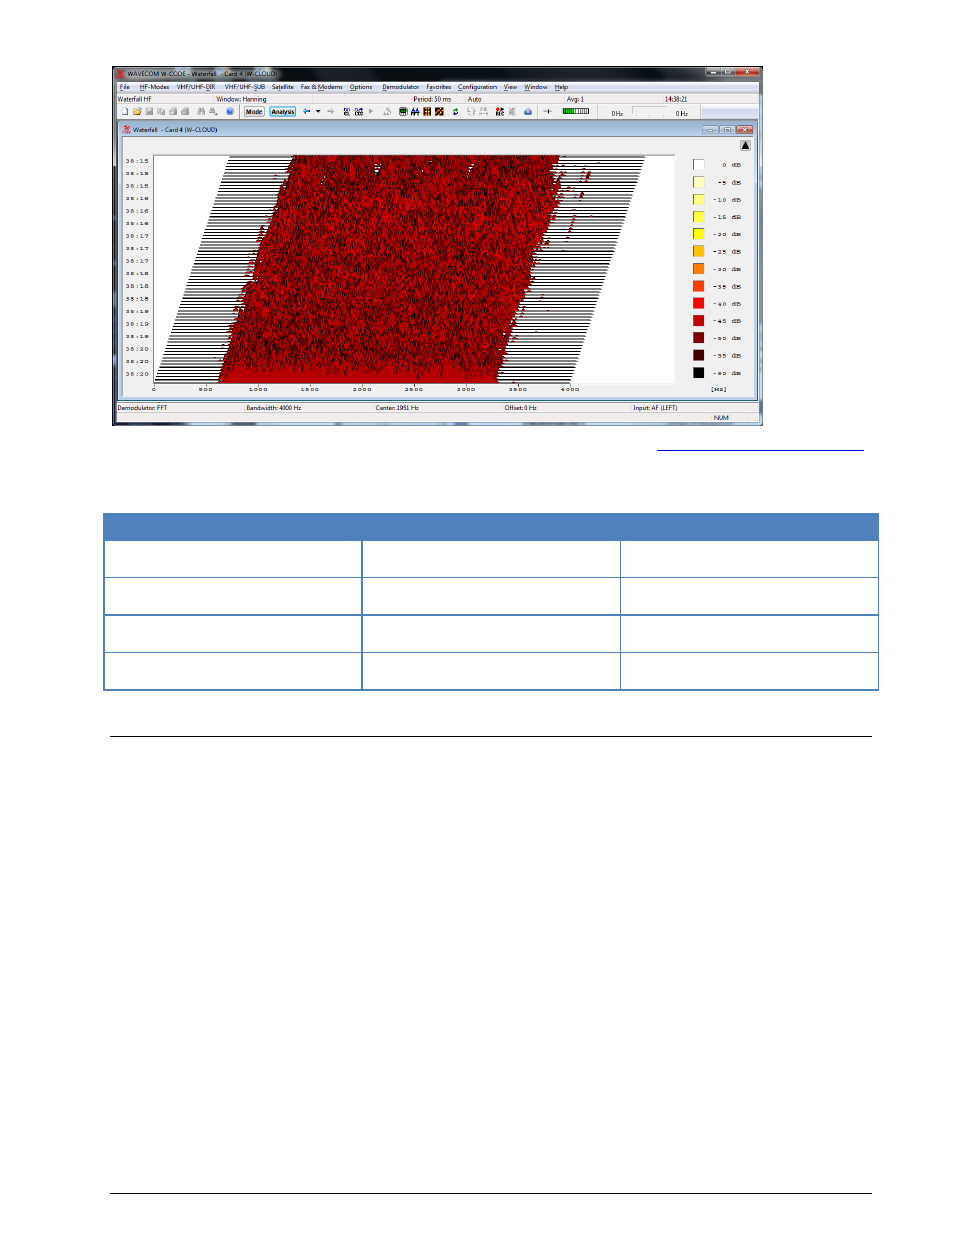
Waterfall (HF, SUB, DIR and SAT)
FFT Type
Start Frequency
End Freqeuncy
Waterfall HF
Offset Frequency
Bandwidth
Waterfall SUB
Offset Frequency
Bandwidth
Waterfall DIR
Offset Frequency – Bandwidth/2
Offset Frequency + Bandwidth/2
Waterfall SAT
Offset Frequency – Bandwidth/2
Offset Frequency + Bandwidth/2
Sonagram
A second widespread method for FFT display is the real-time sonagram, which displays the amplitude and
frequency values produced by the FFT over time. In the sonagram, the signal amplitude is displayed by
colour, with different colours representing different amplitudes. Sometimes this display is also called
“Spectrogram”.
This amplitude related spectrum analysis mode offers many hints to the distribution of a signal spectrum.
The operation is numerically identical to the real-time waterfall analysis, and is simply a different method
of visualisation.