Fsk analysis options – Wavecom W74PC V8.7.0 User Manual
Page 97
WAVECOM Decoder W74PC, W-PCI/e, W-CODE, W-CLOUD Manual V8.7.0
Analysis Tools
87
rence of a baud rate - for gray scale values, white is the highest intensity and black the lowest. A time
stamp points to the latest sample taken. The latest sample is color inverted to distinguish it from the pre-
vious samples.
If the user wishes to examine a particular sample, it may be selected in the waterfall window. The sample
is marked with the time cursor, cursors are placed in the graph window and updating is halted in that win-
dow.
FSK Analysis Options
To assist in the measurement of noisy signals, a peak measurement function and an averaging function
are available. When one of these options is selected the last five samples will be used for calculations. The
result is displayed in the graph window. The user may also select a larger time span as basis for calcula-
tions from anywhere in the waterfall window.
Measure Peak and Average Values
Select the function you wish to use from the Options menu. A checkmark is shown to the left of the op-
tion selected and five samples are inverted in the waterfall window selected to indicate the number of
samples used for the calculations.
If you wish to use a different number of samples in the calculation, place the mouse on the waterfall sam-
ple from which calculation should start, and hold and drag the mouse over as many samples as you want
to use.
The marked samples will be color inverted, cursors will appear in the graph window and the graph display
will show the average or peak value of the marked samples.
To disable peak or average measurement, uncheck it in the Options menu: the cursors will disappear, on-
ly one sample is marked in the waterfall window, and updating of the graph window will resume.
Examine Sample, Display Cursors
Click on the baudrate or the spectrum graph window to display the cursors, or click on the sample in the
waterfall window that you wish to examine. Graph window updates will stop and a pair of cursors will ap-
pear. You may move the cursors along the x-axis in normal Windows fashion. The matching waterfall
sample is marked with the time cursor.
Click on the graph window again to remove the cursors and resume graph window updates.
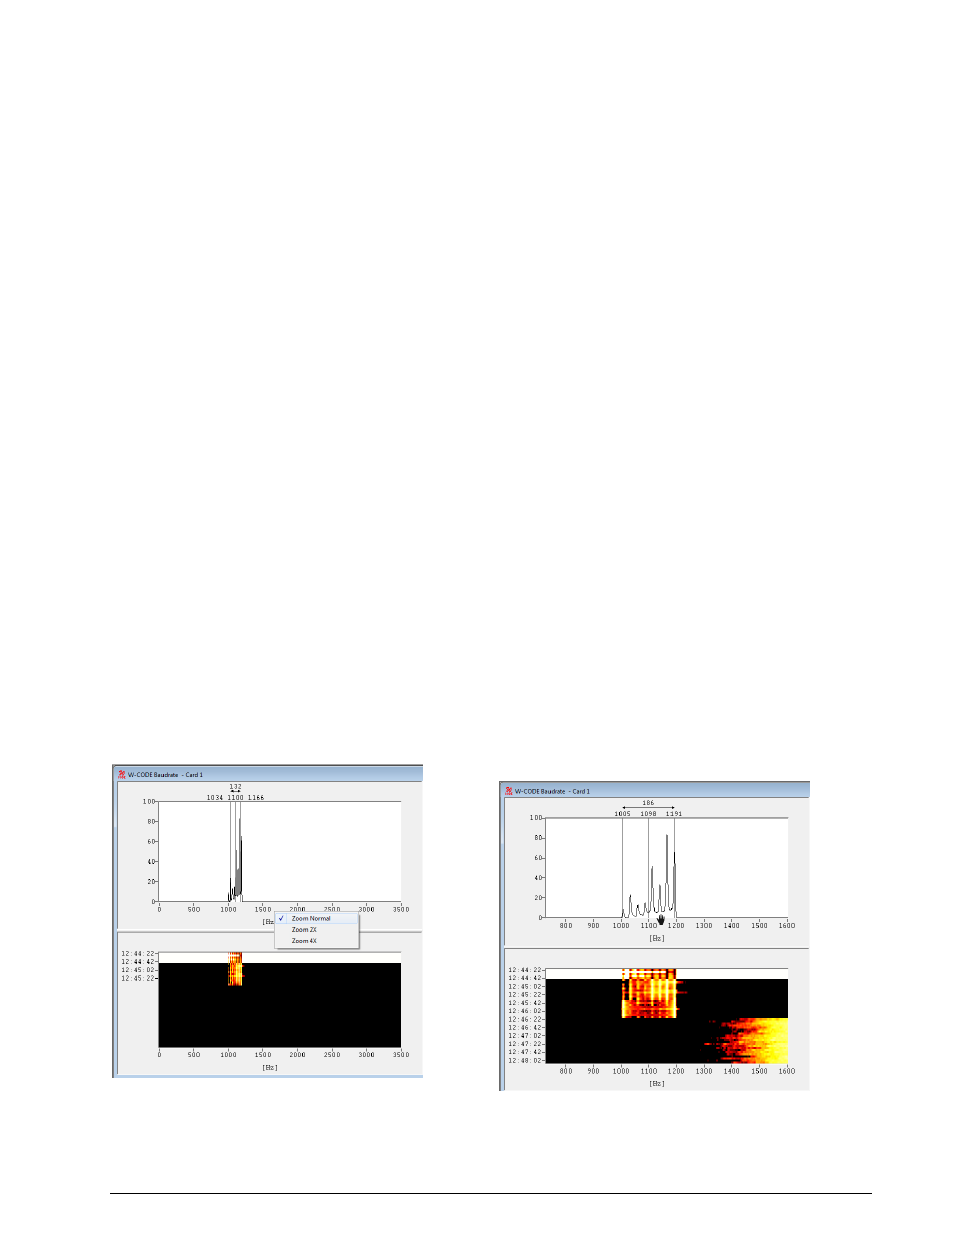
Zoom
Right-click with the mouse into the spectrum
or baudrate graph pane (upper panes) and se-
lect if you like to Zoom 2X or or to Zoom 4X.
To adjust the frequency scale, move the cur-
sor into the range of the frequency scale. If
you see the “Hand”, press the left mouse but-
ton and move the frequency slider.