System debugging, Introduction to system debugging – H3C Technologies H3C SR8800 User Manual
Page 17
5
Step Command
Remarks
1.
Enter system view.
system-view
N/A
2.
Display the routes from
source to destination.
•
For an IPv4 network:
tracert [ -a source-ip | -f first-ttl | -m
max-ttl | -p port | -q packet-number
| -vpn-instance vpn-instance-name |
-w timeout ] * host
•
For an IPv6 network:
tracert ipv6 [ -f first-ttl | -m max-ttl |
-p port | -q packet-number |
-vpn-instance vpn-instance-name |
-w timeout ] * host
Use either approach.
Available in any view.
NOTE:
For more information about the tracert lsp command, see
MPLS Command Reference.
System debugging
Introduction to system debugging
The router provides various debugging functions. For the majority of protocols and features supported,
the system provides corresponding debugging information to help users diagnose errors.
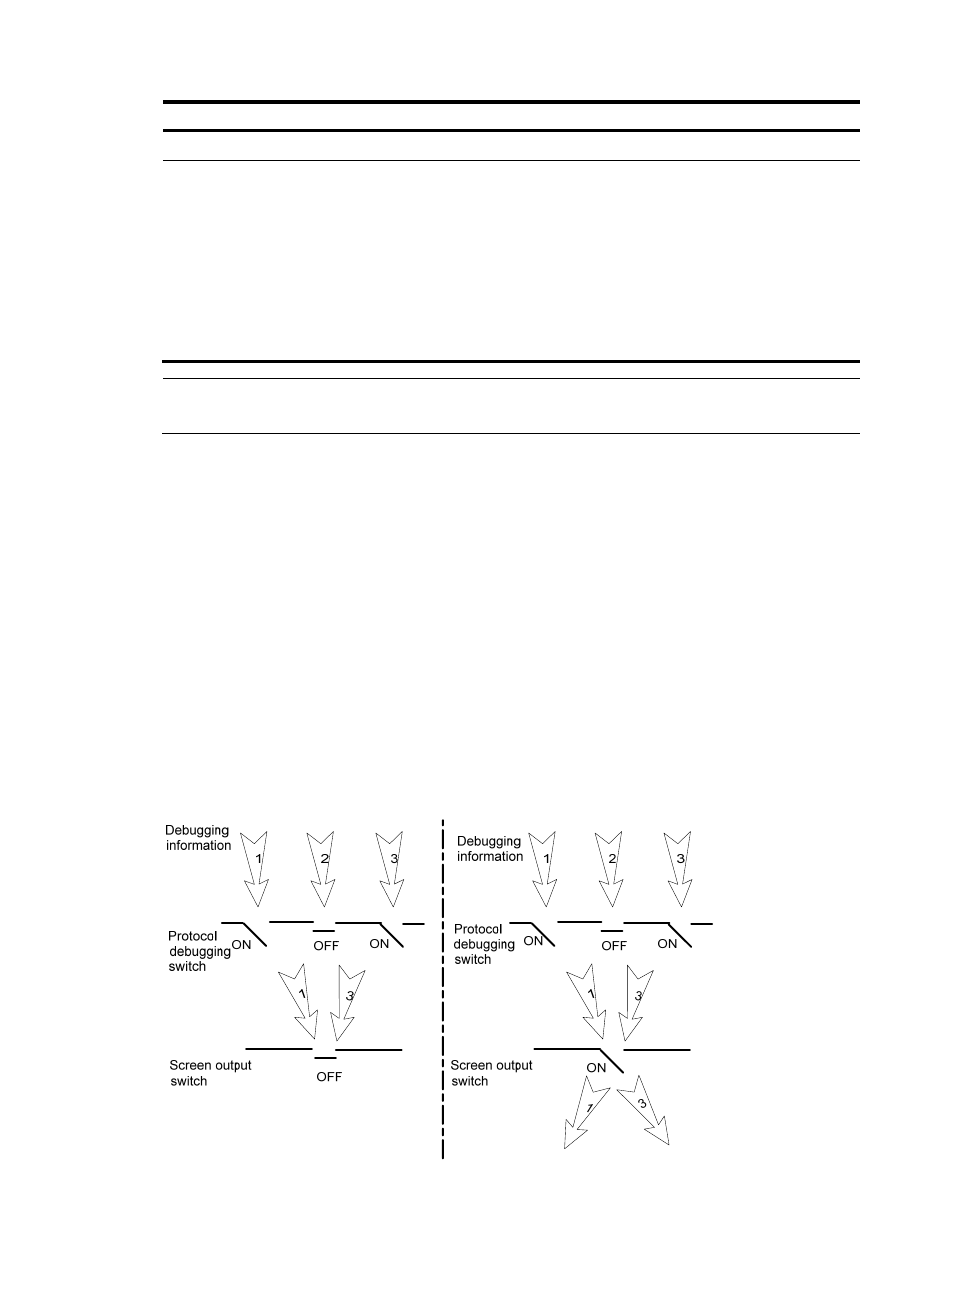
The following two switches control the display of debugging information:
•
Protocol debugging switch—Controls protocol-specific debugging information.
•
Screen output switch—Controls whether to display the debugging information on a certain screen.
illustrates, assume the router can provide debugging for the three modules 1, 2, and 3. The
debugging information is output on a terminal only when both the protocol debugging switch and the
screen output switch are turned on.
Figure 3 The relationship between the protocol and screen output switch
- H3C SR6600-X H3C SR6600 H3C SecPath F5020 H3C SecPath F5040 H3C VMSG VFW1000 H3C WX3000E Series Wireless Switches H3C WX5500E Series Access Controllers H3C WX3500E Series Access Controllers H3C WX2500E Series Access Controllers H3C WX6000 Series Access Controllers H3C WX5000 Series Access Controllers H3C LSWM1WCM10 Access Controller Module H3C LSUM3WCMD0 Access Controller Module H3C LSUM1WCME0 Access Controller Module H3C LSWM1WCM20 Access Controller Module H3C LSQM1WCMB0 Access Controller Module H3C LSRM1WCM2A1 Access Controller Module H3C LSBM1WCM2A0 Access Controller Module